КАТЕГОРИИ:
Архитектура-(3434)Астрономия-(809)Биология-(7483)Биотехнологии-(1457)Военное дело-(14632)Высокие технологии-(1363)География-(913)Геология-(1438)Государство-(451)Демография-(1065)Дом-(47672)Журналистика и СМИ-(912)Изобретательство-(14524)Иностранные языки-(4268)Информатика-(17799)Искусство-(1338)История-(13644)Компьютеры-(11121)Косметика-(55)Кулинария-(373)Культура-(8427)Лингвистика-(374)Литература-(1642)Маркетинг-(23702)Математика-(16968)Машиностроение-(1700)Медицина-(12668)Менеджмент-(24684)Механика-(15423)Науковедение-(506)Образование-(11852)Охрана труда-(3308)Педагогика-(5571)Полиграфия-(1312)Политика-(7869)Право-(5454)Приборостроение-(1369)Программирование-(2801)Производство-(97182)Промышленность-(8706)Психология-(18388)Религия-(3217)Связь-(10668)Сельское хозяйство-(299)Социология-(6455)Спорт-(42831)Строительство-(4793)Торговля-(5050)Транспорт-(2929)Туризм-(1568)Физика-(3942)Философия-(17015)Финансы-(26596)Химия-(22929)Экология-(12095)Экономика-(9961)Электроника-(8441)Электротехника-(4623)Энергетика-(12629)Юриспруденция-(1492)Ядерная техника-(1748)
Train Service Planning
|
|
|
|
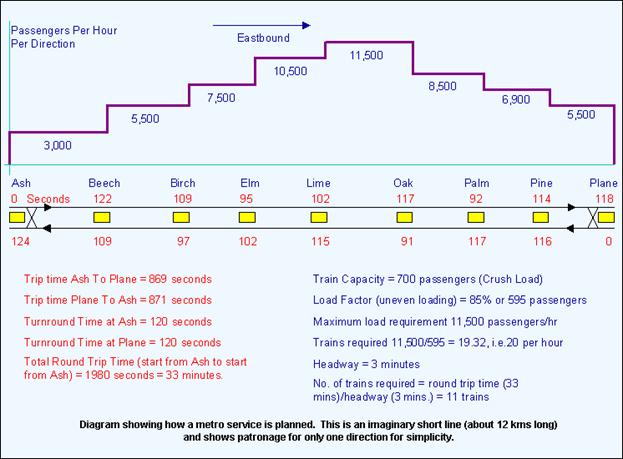
Here is an example of how a train service is planned for the peak hour of a short metro line. The diagram below shows the elements involved in planning the train service.
First, you have to find out how many passengers will use the service. This involves assessing the numbers of people in a given area who will come to the station during each hour of the day and how they will get there. Some will walk, some will use a bus service (if there is a good connection) and some will drive, if there is cheap parking. For walkers, 500 to 800 metres is about the limit. Bus users will usually prefer to get a direct route and good integration of transport will allow bus routes to be organised to feed rail stations. Often, this process requires political commitment - essential if the resources are to be used properly.
The next stage is to determine where the people want to go and when. For planning a new railway, this will be critical in deciding the best route. For existing lines, the development of the city may already have resulted from the routing of lines as it did in New York and London.
All of this "origin and destination" patronage data (укр. – клієнтура) is fed into a computer program and the numbers for each station, each direction and during each hour are derived. Such programs are usually owned by consulting companies who are engaged to do the work or who licence the operator to use the software. The end result is a set of numbers for each station which show:
· Passengers boarding trains in each direction
· Passengers alighting from trains in each direction
· Passengers riding on trains between stations for each direction
· Passengers transferring from line to line at interchange stations (if any)
To allow the train service to be planned, the patronage study generates "passengers per hour per direction" (pphpd) as shown at the top of the diagram above. In our case, we see the passenger numbers travelling between each station but, for simplicity, only the eastbound direction. The "curve" generated will not necessarily look like the one above on a suburban route, where there is often a build up starting at one end of the line which carries on building up until the terminus is reached and the train is full (to bursting sometimes).
|
|
|
|
Дата добавления: 2014-01-11; Просмотров: 643; Нарушение авторских прав?; Мы поможем в написании вашей работы!