КАТЕГОРИИ:
Архитектура-(3434)Астрономия-(809)Биология-(7483)Биотехнологии-(1457)Военное дело-(14632)Высокие технологии-(1363)География-(913)Геология-(1438)Государство-(451)Демография-(1065)Дом-(47672)Журналистика и СМИ-(912)Изобретательство-(14524)Иностранные языки-(4268)Информатика-(17799)Искусство-(1338)История-(13644)Компьютеры-(11121)Косметика-(55)Кулинария-(373)Культура-(8427)Лингвистика-(374)Литература-(1642)Маркетинг-(23702)Математика-(16968)Машиностроение-(1700)Медицина-(12668)Менеджмент-(24684)Механика-(15423)Науковедение-(506)Образование-(11852)Охрана труда-(3308)Педагогика-(5571)Полиграфия-(1312)Политика-(7869)Право-(5454)Приборостроение-(1369)Программирование-(2801)Производство-(97182)Промышленность-(8706)Психология-(18388)Религия-(3217)Связь-(10668)Сельское хозяйство-(299)Социология-(6455)Спорт-(42831)Строительство-(4793)Торговля-(5050)Транспорт-(2929)Туризм-(1568)Физика-(3942)Философия-(17015)Финансы-(26596)Химия-(22929)Экология-(12095)Экономика-(9961)Электроника-(8441)Электротехника-(4623)Энергетика-(12629)Юриспруденция-(1492)Ядерная техника-(1748)
Testing Knowledge on the Basis of Stochastic Analysis
|
|
|
|
Elena Igorevna Shkurina1, Yuriy Ivanovicn Shkurin1
1Southern Federal University, Russia, 344006, Rostov-on-Don, Bolshaya Sadovaya Str., 105 / 42
phone: +7(919)-882-02-99, e-mail [email protected]
Abstract: This article deals with development of models for investigation problems of testing student’s knowledge. The model of stochastic regression analysis and the linear model of observation are considered. Stochastic regression analysis allows to identify the relations between test’s parameters and the results of testing. Example of calculation mathematical expectation and variance the results of testing are shown. Linear model allows to determine the effect of test parameters on the output parameter, such as test score. The model application in assessing the test results in mathematics is shown.
Keywords: Testing knowledge,test results, modeling, statistical data, regression analysis, linear model of observation.
Introduction. The use of simulation and parameterization for testing are necessary for effective organization measurement process students preparedness level in certain knowledge area Testing is applied at the different levels of education: secondary education, undergraduate level, master level, and also for assessing the level of training for employment. While hiring mostly used psychological tests.
In this article attention is paid to task of assessing knowledge in organized pedagogical testing. Assessing of knowledge is based on the measurement results. Measurements are carried out by analogy with the measurements of physical quantities and are reflected in the metric logit scale. This approach to measurements provide an objectivite assessment of trainees students. Family of theoretical models and methods of testing are called Rasch parameterization models [1]. Rasch model allows to obtain objective assessments knowledge of trainees. Assessment of the level students' knowledge does not depend on the difficulty of the test when applying these models. Rasch model is useful for solving optimization problems of the educational process, as evaluation of the effectiveness of pedagogical innovation, technology and etc [2-5].
Application of stochastic regression analysis to identify the relationship between the test parameters and test results, and the application of the linear observations model are discussed in the article.
Stochastic regression model. In the investigation of the test results have to consider simultaneously two, three and more values. These values represents the point with random coordinates at the measurement space. The measurement result is considered as the random outcome of an event. Statistical data can be tabulated with two, three, etc. inputs [6]. One of these tables is Table 1. The two-dimensional value (X, Y) is considered as a discrete random variable as a random vector, or point of a plane with random coordinates (X, Y).
Table 1 – Bivariate distribution
|
|
|
| X Y | x1 | x2 | … | xi | … | xn | … |
| y1 | p(x1,y1) | p(x2,y1) | … | p(xi,y1) | … | p(xn,y1) | p(y1) |
| y2 | p(x1,y2) | p(x2,y2) | … | p(xi,y2) | … | p(xn,y2) | p(y2) |
| … | … | … | … | … | … | … | … |
| yj | p(x1,yj) | p(x2,yj) | … | p(x2,yj) | … | p(x2,yj) | p(yj) |
| … | … | … | … | … | … | … | … |
| ym | p(x1,ym) | p(x2,ym) | … | p(xi,ym) | … | p(xn,ym) | p(ym) |
| … | p(x1) | p(x2) | … | p(xi) | … | p(xn) | … |
In Table 1, a cell with coordinates (xi, yj) indicates the probability p(xi, yj) (i =1,2,…, n; j =1,2,…, m) that as a result of testing random test result X takes the value xi and at the same time random test result Y will be set to yj. The value p(xi,yj) is considered as the probability of coincidence events (Х=хi) and (Y=yj). Row of Table 1 are normalized, i.e. sum of the probabilities of each row is equal to one.
Summarizing all probability, standing in the column i
 (1)
(1)
will obtain the probability of the event Х=хi,  .
.
Summarizing probability in the row j, find:
 . (2)
. (2)
Testing student’s knowledge provides random results. Relationship between two random events manifested in the fact that the conditional probability of occurrence of the first event at the second event is different from the unconditional probability of the first event [7]. Effect of a one event to change another event can be investigated, with random results of testing student’s knowledge. This effect manifests in the form of a conditional distribution law of the first event for fixed values of the second event [8].
Let test result Х received one of its values X=xi, and the other test result Y may take any of their possible values у1, у2,..., yj,... Probabilities of these values will be different from the probability р(y1), p(у2),...., p(yj),…
Conditional probability of the event Y=yj, if observed event Х=хi is equal to the  = р(уj/хi) such, that
 . (3)
. (3)
Set of conditional probabilities р(у1/хi), р(у2/хi), … р(уj/хi), р(уj+1/хi),… is called the conditional distribution of Y when Х=хi [7]. Sum of conditional probabilities according to (1) and (3) is equal to unity, i.e.
 . (4)
. (4)
To describe these conditional distribution laws evaluation of test results will apply the conditional expectation М(Y/х) of the test result Y for a fixed value of a test result Х=х, where x can take values х1, х2,..., хi,... The mathematical expectation defined by the equality
 . (5)
. (5)
You can also enter the conditional variance and conditional moments of higher orders. Taking into account (1) and (3) the mathematical expectation М(Y/х) defined as follows:
 . (6)
. (6)
With the change in x for the transition from one column of Table 1 to the other varies and M(Y/x). Function  for values of x = х1, х2,..., хi,.. called the regression Y by X [7].
Similarly possible to consider the conditional laws of test result X for fixed values of a test result Y=yj, defined by a set of conditional probabilities
 (7)
(7)
for i =1, 2,..., where
 . (8)
. (8)
Function  for the values of y = y1, y2,..., yj,.. is called the regression of X on Y [7]:
 . (9)
. (9)
The model can be generalized to any number of parameters of the testing process. When the three parameters we obtain a three-dimensional density р(х, у, z), by which it is possible to calculate the three two-dimensional density pXY(x,y), pXZ(x,z), pYZ(y,z) and three one-dimensional density pX(x), pY(y) и pZ(z).
|
|
|
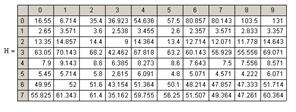
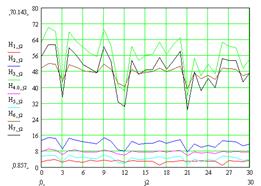
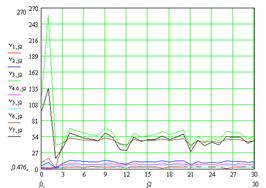
There is a software for the model application [9]. The use of this model has the following result. Let there exist the following test parameters: Xi - group of examinees, i = 1,…,30; Y1 - number variant; Y2 - the number of completed tasks А+В; Y3 - percentage of completion; Y4 - the number of completed tasks group А; Y5 - the number of completed tasks group В; Y6 - the total score for the test, obtained i -th examinee; Y6 - rating. Mathematical expectation М(Y/х) of value Y, where x may be equal to х1, х2,..., хi,.., defined by the equality  , where x – one of the meanings х1, х2,..., хi,…. Expression М(Y/х) can be written in the form
 . (10)
Calculation of the mathematical expectation and variance for the input parameters is shown in Figure 1 and Figure 2.
| 
|
Figure 1 – Average of distribution
| 
|
Figure 2 – Distribution of deviation
Linear model of observations. Testing can be identified with the supply at the input of the “black box” the vector of input actions X=(x1,x2,…,xn). At the output will be obtained vector of the output parameters Y=(y1,y2,…,yn). Testing can be considered as the task of planning the experiment [10]. Investigation of testing can be carried out in order to find the extremum of function of one or more output parameters.
Mathematical model of the testing process can be represented as the system of equations:
yi=fi(x1, x2, …, xk),  , (11)
where the input measured variables xj are called factors, and the functions fi(x1, x2, …, xk) ‑ где входные измеряемые переменные xj называют факторами, а функции fi(x1, x2, …, xk) ‑ the response functions.
For each factor of testing must be specified domain of definition Xj. Testing can be planned by setting values of the factors, presenting to them the requirements of compatibility and lack of linear correlation. Testing is considered as an experiments in order to identify the parameters of a "black box." Under the term "black box" mean learners in the education system.
Consider the concept of a linear model of observations applied to the testing of knowledge.
Suppose there are n measurements y1, y2, …, yn of a random test parameter Y, for which
M{yi} = xi1b1 + xi2b2 +…+ xipbp,  , (12)
 (13)
(13)
where b={b1,b2,…,bn} ‑ vector of unknown parameters; s2 ‑ variance, X=(xij), ,  ‑ matrix of known coefficients of the order n´p; cov{yi,yj}=M(yi–M{yi})(yj–M{yj}) ‑ covariance between the yi and yj; M {…} – mathematical expectation operation.
In vector form: M { Y }= Xb; D { Y }= s2In, wherе Y={y1,y2,…,yn}T ‑ column vector parameter of testing; b={b1,b2,…,bn}T ‑ column vector of unknown parameters; M{Y} ‑ mathematical expectation of the column vector Y, M{Y} ={ M{y1},M{y2},…,M{yn} } Т, M{Y}=(cov{yi,yj})=s2In ‑ covariance matrix of the parameter vector of testing Y; In ‑ the identity matrix of order n.
Unknown parameters b1,b2,…,bn are the regression coefficients. They are subject to assessment by measuring the test parameters y1,y2,…,yn using least-squares method by the formula:
 , (14)
where  least squares estimator (LS-estimator) unknown parameters bi. In matrix form, equation (14) has the form:
XTXB=YTX. (15)
If the rank of matrix X is equal to p, then equation (15) has a unique solution. Vector estimates  of unknown parameters { bj } is determined from the formula
 . (16)
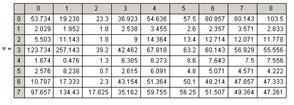
Consider the application of this model. Table 2 shows the test results of students in the subject "Mathematics". According to the Table 2 should be find an estimate and explore the regression equation of the form:
|
|
|
 . (17)
Table 2 – Test results in mathematics
| # | test score | Achieved: Group A | Achieved: Group B | percentage of completion | # | test score | Achieved: Group A | Achieved: Group B | percentage of completion |
The sample size n=N is determined by the number of examinees (n =71); number of factors Xk, k =3; resultative variable: Y - total score for the test, obtained i -th examinee. Factors: X1 - the number of completed tasks group А; X2 ‑ the number of completed tasks group В; X3 - percentage of completion.
Investigate the initial signs for the presence of multicollinearity. Construct the matrix of pair correlation coefficients R, to know the degree of dependence on each other investigated parameters.
|
|
|
Calculate the mathematical expectation of regressors X1, X2, X3 and resultative variable Y by the formulas:  ,
,  , n =71, i =1,2,3. Obtain the results shown in Table 3.
Table 3

| 
| 
| 
|
| 49,732 | 5,352 | 63,07 |
Calculate the variance regressors X1, X2, X3 and resultative variable Y by the formulas:  ,
,  , n =71, i =1, 2, 3. Obtain the results shown in Table 4.
Table 4

| 
| 
| 
|
| 24,957 | 2,535 | 3,862 | 223,896 |
Estimates of pair correlation coefficients characterize the dependence of the two selected factors under the influence of all other factors.
To find these estimates apply the formula:
 . (18)
The calculated values can be written in the form of a correlation matrix:
The coefficients of matrix R have the meanings | r12 |, | r13 |, | r14 |,| r24 |, | r34 |>0,8. Consequently, there is multicollinearity. In the regression equation should be included only one of the indicators хj or хi. Find estimates of the regression equation. Construct the following matrix for a given equation:
 , (19)
 , (20)
 , (21)
 . (22)
Will obtain a vector of regression coefficients (watch formula (16)):
 . (23)
Model of results of testing has the form of the regression equation:
 .
.
This model allows to carry out research of influence of factor variables on the total test score.
Conclusion. Testing knowledge modelon the basis of stochastic regression analysis is developed. The model allows to investigate simultaneously two, three and more quantities of test results. In the investigation estimated stochastic relationship one parameter to another in the form of a conditional distribution law of the first indicator for fixed values of the second parameter. The model allows to investigate both test materials and system of education itself.
Linear model of observations for research testing is considered. In the model the testing identified with submission on input "black box" of the vector of input actions and the output vector can be obtained the output parameters. This model allows us to investigate not only the level of preparedness of students, but also the quality of the test materials used for the control, which allows to increase the the adequacy of knowledge assessment tested.
|
|
|
|
Дата добавления: 2015-05-29; Просмотров: 389; Нарушение авторских прав?; Мы поможем в написании вашей работы!