КАТЕГОРИИ:
Архитектура-(3434)Астрономия-(809)Биология-(7483)Биотехнологии-(1457)Военное дело-(14632)Высокие технологии-(1363)География-(913)Геология-(1438)Государство-(451)Демография-(1065)Дом-(47672)Журналистика и СМИ-(912)Изобретательство-(14524)Иностранные языки-(4268)Информатика-(17799)Искусство-(1338)История-(13644)Компьютеры-(11121)Косметика-(55)Кулинария-(373)Культура-(8427)Лингвистика-(374)Литература-(1642)Маркетинг-(23702)Математика-(16968)Машиностроение-(1700)Медицина-(12668)Менеджмент-(24684)Механика-(15423)Науковедение-(506)Образование-(11852)Охрана труда-(3308)Педагогика-(5571)Полиграфия-(1312)Политика-(7869)Право-(5454)Приборостроение-(1369)Программирование-(2801)Производство-(97182)Промышленность-(8706)Психология-(18388)Религия-(3217)Связь-(10668)Сельское хозяйство-(299)Социология-(6455)Спорт-(42831)Строительство-(4793)Торговля-(5050)Транспорт-(2929)Туризм-(1568)Физика-(3942)Философия-(17015)Финансы-(26596)Химия-(22929)Экология-(12095)Экономика-(9961)Электроника-(8441)Электротехника-(4623)Энергетика-(12629)Юриспруденция-(1492)Ядерная техника-(1748)
Action -Table 2 страница
|
|
|
|
Figure 239: Show/hide status bar
14.3.5 Show project’s tree and tabs
Different options allow you to customize the main ITC-PC window. It is possible to show/hide the project tree, project tabs or multiply tabs.
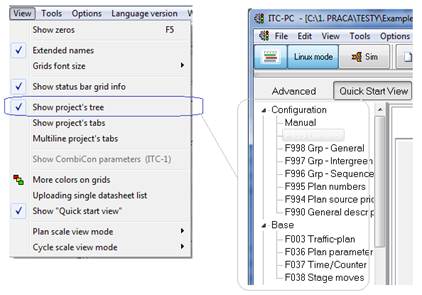
Figure 240: Show/hide project tree
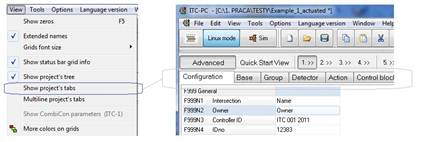
Figure 241: Show/hide project tabs
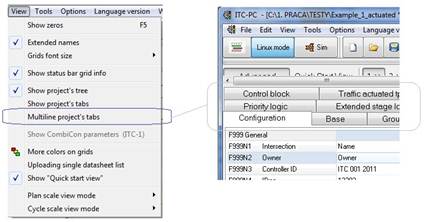
Figure 242: Multiply tabs
14.3.6 Colors in grids
More colors in grids highlight most often use parameters and help to navigate within an ad- vanced ITC-PC mode.
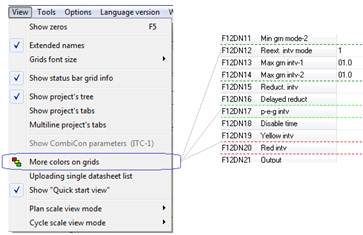
Figure 243: Multiply tabs
14.3.7 Uploading single data sheet list
Uploading a single data sheet panel list allows to check some few configuration functions and sends them all one by one as a single datasheet to the controller. Checking this option in the Menu-View makes the panel visible.
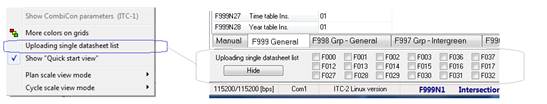
Figure 244: Uploading single datasheet list
14.3.8 Show Quick Start View mode
Show ”Quick Start View” activates the graphical programming mode. More about switching to
Quick Start View: section Advance and Quick Start View programming mode page 16
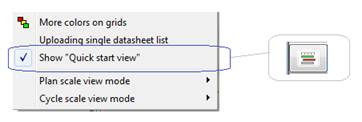
Figure 245: Quick Start View mode
14.3.9 Plan scale view mode
There are two different scale viewing modes:
• Cycle scale view - traditional view showing scale in seconds [s] (1)
• Stage scale view - specific view showing stage starting points (2). This mode helps to understand how the ITC controller understands stages and where the beginning of each stage is.
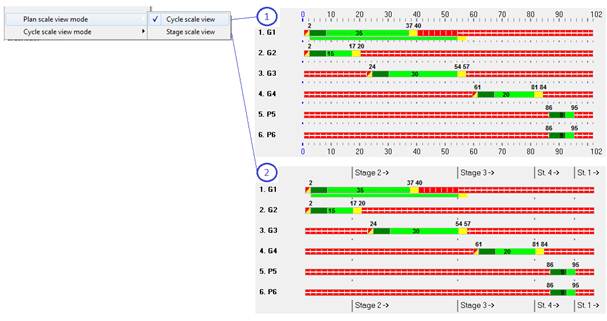
Figure 246: Plan scale view modes
14.3.10 Cycle counter reset indicator
The cycle counter reset indicator can be shown in a two different modes:
• With considering F3PN14 parameter,
• Without considering F3PN14 parameter,
More about Cycle counter reset options see: section Cycle counter reset on page 51
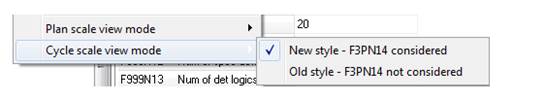
Figure 247: Plan scale view modes
14.4 Main Menu - Tools
Menu Tools contain all uploading/downloading functions and additionally some other specific tools.
14.4.1 Tools - uploading/downloading
More about uploading/downloading functions see: APPENDIX I section 13 page 135
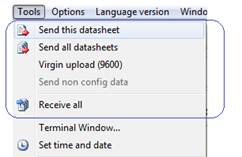
Figure 248: Tools uploading/downloading
You can also click on the (Send this datasheet, Send all data or Receive all data)
button on the main tool bar.

14.4.2 Terminal window
A terminal window allows to use terminal commands to interact with the ITC controller. For example, it is possible to open the security code levels (command L1, L2), switch the lamps ON/OFF (commands ON, OFF) or get the current controller status (command STATUS). More about terminal communication and terminal commands find in ”ITC-2 Service Manual”.
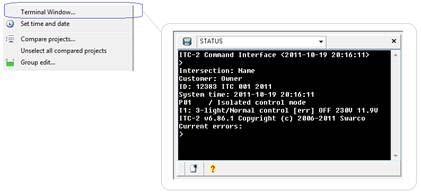
Figure 249: Terminal window
You can also click on the (Terminal window) button on the main tool bar.

14.4.3 Set time and date
The function ”Set time and date” in the controller has to correspond to the local computer’s time and date.
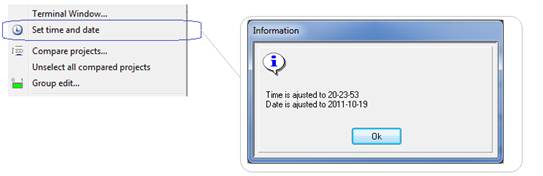
Figure 250: Set time and date
You can also click on the (Set time and data) button on the main tool bar.

14.4.4 Compare projects
Comparing projects is a very useful function, which enables you to check differences between two projects.The ITC-PC software is a multi window software and it is possible to open more then one project. If more than one project is open, you can compare them.
Mark two of the opened projects from the menu (1) or from the tool bar pressing the compare
button (2). Software generates a list of differences (3). Double clicking on any of the differ-
ences will show you the exact place in the configuratoin where the specific difference was found (4).
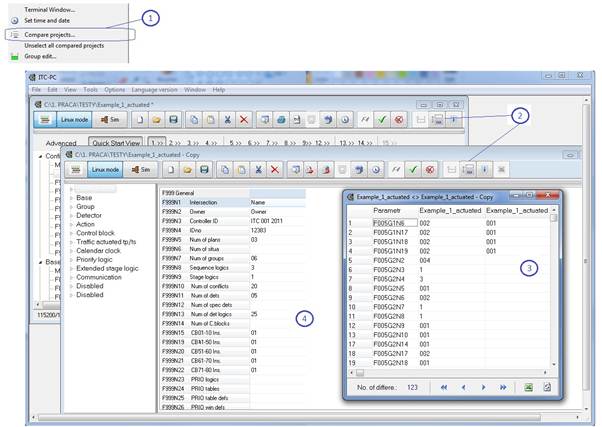
Figure 251: Compare projects
You can also click on the (Compare projects) button on the main tool bar.
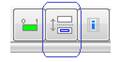
14.4.5 Group Edit
The group edit function displays window with most important information concerning currently selected signal group/column (available only in advanced view). Group edit window shows min times (1) and all detector logics (2) associated with selected group number.
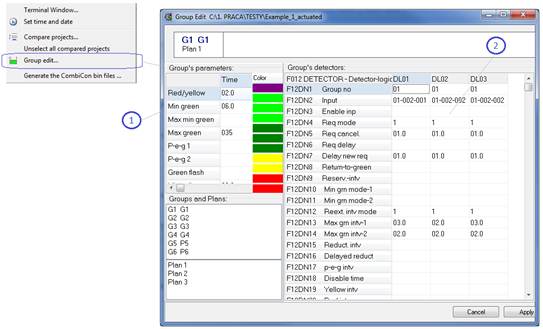
Figure 252: Group Edit
You can also click on the (Group edit) button on the main tool bar.
14.5 Main Menu - Options
14.5.1 Communication options
To learn more about different communication options see: APPENDIX I section 13 page 135
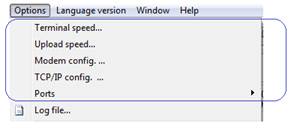
Figure 253: Communication options
14.5.2 Log file
The function open the log file contains information about the latest communication activity (uploading or downloading). It is a very detailed log, describing in details what was send and received to/from the controller and if there where any difficulties. Whenever you have a problem with communicating with the controller check the Log file first.
The log file lists all functions sent to the controller (1). It also shows the whole package (2) sent to the controller and the response from the controller (3) ACK (package accepted) or NAK (package not accepted for example because of wrong checksum).
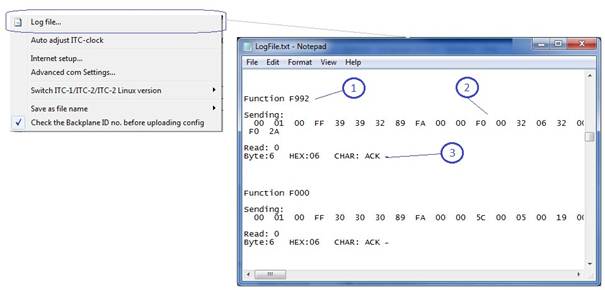
Figure 254: Log file
14.5.3 Adjust ITC-clock
”Adjust ITC-clock option” activates setting time and date in the ITC controller with every single uploading configuration procedure.
To learn more about setting time see: Set time and date section 14.4.3 page 155

Figure 255: Adjust ITC-clock
14.5.4 ITC-1, ITC-2 and ITC-2 Linux modes
The ITC-PC software is compatible with all previous ITC controller versions. It is important to switch the ITC-PC software to the specific mode before uploading/downloading data to/from the different ITC controller versions.
For the ITC-2 Linux version always make sure that the Linux mode is enabled.
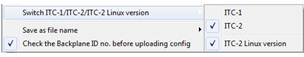
Figure 256: ITC-1, ITC-2 and ITC-2 Linux modes
14.5.5 Default file name
There are two default predefined save options file names generated automatically. You can choose one from two options: extended (1) or short (2) file name.
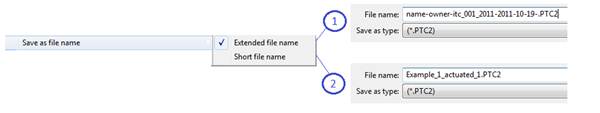
Figure 257: Default file name
14.5.6 Check the Backplane ID
The function enable/disable checking the Backplane ID number when uploading all data to the ITC controller.

Figure 258: Check Backplane ID
14.6 Main Menu - Language version
The ITC-PC interface can be displayed in two different language versions: English and alterna- tive (for example Spanish, Polish or Russian). You can change the language interface version at any moment from the Menu - Language version:
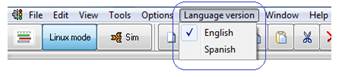
Figure 259: Language version
14.7 Main Menu - Window
It is possible to display windows in a different order when more than one projects are open: Cascade, Horizontal, Vertical. List of the currently open projects gives you an easy access and helps to switch between windows.
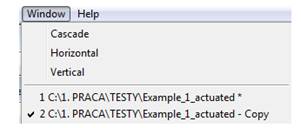
Figure 260: Window
14.8 Main Menu - Help
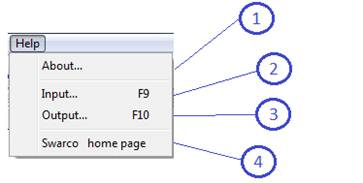
Figure 261: Help
• About... - open window with informations about the current software version number (1),
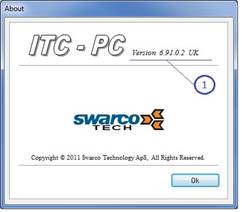
Figure 262: About
• Input... - open window with the list of different available input types you can use in the
ITC configuration (2),
• Output... - open window with the list of different available output types you can use in the ITC configuration (3),
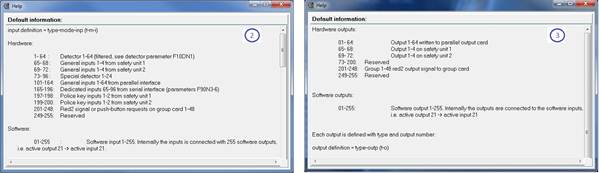
Figure 263: Output
• Swarco home page (4) - www.swtech.dk
Figure 264: www.swtech.dk
15 APPENDIX III - Mains supervision
15.1 Mains voltage [V]
The page ”Mains [V]” gives some additional mains voltage supervision options. It is based on two sections: basic and advanced, designated for those who wants to achieve a very precise and strict level of supervising mains voltage.
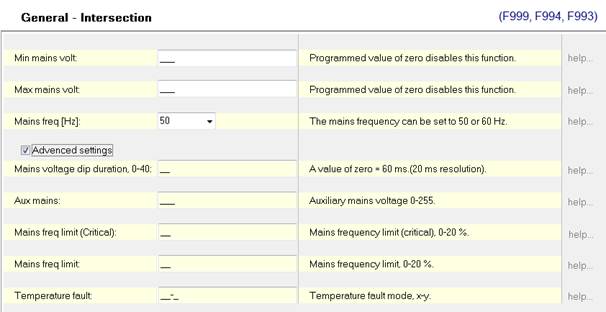
Figure 265: Mains
15.2 Minimum mains voltage 0-255 V
The controller switches instantly to the failure mode with dark lamps, when the mains voltage drops below this value and the duration of the voltage dip is equal or longer than specied in F993N4. The controller remains in this mode until the mains voltage again has been a least 5 seconds. A programmed value of zero disables this function.

Figure 266: Minimum mains voltage
15.3 Maximum mains voltage 0-300 V
The controller switch instantly to the failure mode with dark lamps when the mains voltage is above this value. The fault will be cleared again when the mains voltage has been inside the interval between the minimum and maximum for more than 10 seconds. A value of zero will disable the checking of maximum voltage.

Figure 267: Maximum mains voltage
15.4 Mains supply frequency 50-60
The mains frequency can be set to 50 or 60 Hz.

Figure 268: Mains supply frequency
15.5 Mains voltage dip duration 0-40
The value is given in 20 ms resolution. A value of zero will internally be considered as 60 ms.

Figure 269: Mains voltage dip duration
15.6 Auxiliary mains voltage 0-255
An extra mains voltage value can be defined to achieve a state in which a fall in mains voltage below this value will force the controller into a controlled shut-down mode (see also F999N41). Flashing yellow will be displayed in failure mode if not F993N1 is set to dark failure mode (+2). The value must be above the minimum value defined in parameter F993N2. A value of zero disables this function

Figure 270: Auxiliary mains voltage
15.7 Mains frequency limit (critical) 0-20
The controller will switch to the failure mode when the mains frequency variation is more than the +/- limit. The fault will be cleared again when the frequency has been within the limit for at least 10 seconds. A value of zero will disable this function.

Figure 271: Mains frequency limit
15.8 Mains frequency limit 0-20
The controller will set a fault when the mains frequency variation is more than the +/- limit. The fault will be cleared again when the frequency has been inside the limit for at least 10 seconds. A value of zero will disable this function.

Figure 272: Mains frequency limit
16 APPENDIX IV - Capacity evaluation module
16.1 Introduction
Capacity evaluation module allow you to check your intersection performance under the pre- defined traffic control conditions. Open the Capacity evaluation module and follow 5 steps procedure in order to achieve final results.

Figure 273: Capacity evaluation button
The whole ITC configuration has to be ready and prepared with using the graphical interface - see: ITC configuration section 4.1 page 18
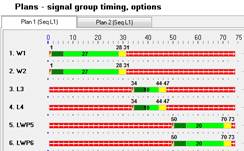
Figure 274: ITC configuration - graphical mode
16.2 Step 1 - Intersection layout
Define the layout of the intersection: number of legs, traffic lanes, approaches, departures etc.
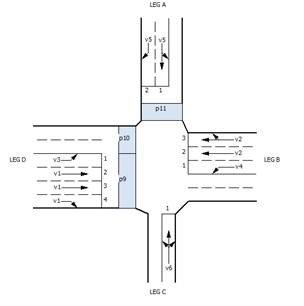
Figure 275: Intersection layout
16.2.1 Number of legs
Define the number of legs:

Figure 276: Number of legs
16.2.2 Number of approaches/departures
Define the number of approaches and departures as you see it on the junction,
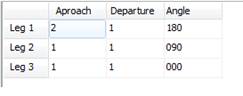
Figure 277: Number of approaches/departures
16.2.3 Traffic lanes and movements
Define the directions and the signal group associations. 3,5 m is a default lane width and can be changed.
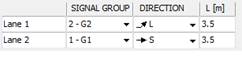
Figure 278: Number of legs
16.2.4 Approach grade
Define the approach grade for each leg.
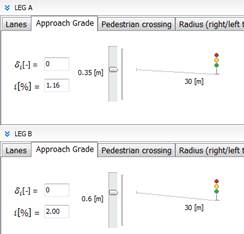
Figure 279: Approach grade
16.2.5 Pedestrian crossing
Locate the pedestrian crossings (choose the distance C and the signal group association):
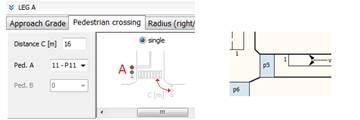
Figure 280: Pedestrian crossing
16.2.6 Turning radius
Turning radius might influence the final results. It is as well important to clarify values as they are on site.
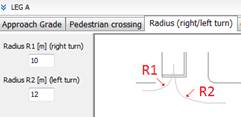
Figure 281: Approach grade
16.3 Step 2 - Traffic flows
Define the traffic flow and HGV ratio according to your traffic studies. It is possible to declare few different periods.
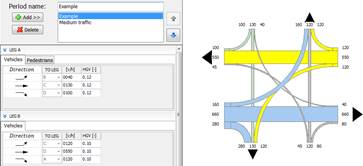
Figure 282: Traffic flows
16.4 Step 3 - Saturation flow
Check the Saturation flow evaluation and modify specific factors if necessary:
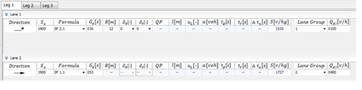
Figure 283: Saturation flow
Use Glossary to check the meaning of each factor.
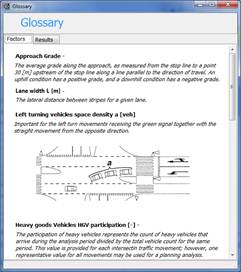
Figure 284: Help
16.5 Step 4 - Results
Results grouped on the Step 4 present the traffic conditions on each lane group.
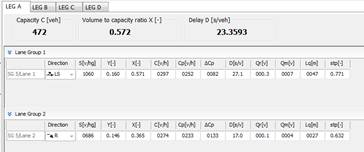
Figure 285: Lane group results
Use Glossary to check the meaning of each value result.
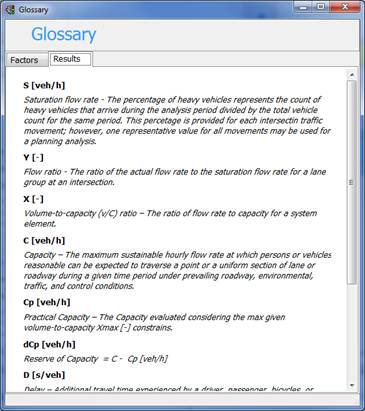
Figure 286: Help 2
16.6 Step 5 - Results
Results on the step 5 present the overall intersection performance. Values are presented for each leg and for the whole junction both in tabular and graphical way:
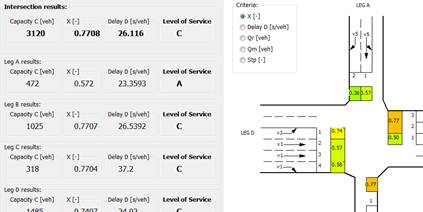
Figure 287: Lane group results
You can also visualize separate results on the signal group plan. Hear each single green or cycle time modification impact of the result on-line:
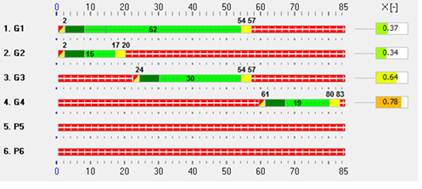
Figure 288: Capacity evaluation results in Plans
17 APPENDIX V - Intersection documentation
You can create a document from you ITC configuration. Select Reports function from the Main
Menu bar and choose your preferable template from the list:
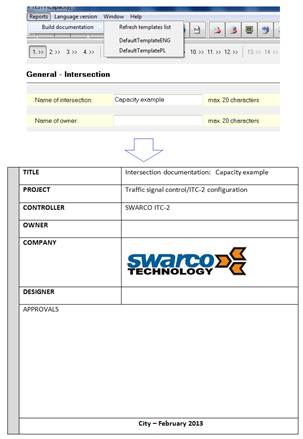
Figure 289: Main menu Report function
Modify and save your own template files which can be found in.Work¿WordTemplates folder:
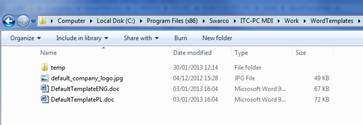
Figure 290: Main menu Report function
18 EXAMPLE I
18.1 Intersection layout
The interaction has 6 vehicle groups (G1, G2, G3, G4, G5 and G6) and 3 pedestrian groups (P1, P2, P3).
There are 4 loop detectors (D1, D2, D3, D4) on the main road and 4 video detectors on the side roads (C1, C2, C3, C4). Video detectors connects to the digital input terminal. The pedestrian push buttons (P1, P2, P3) connects to the Aux/Red2.
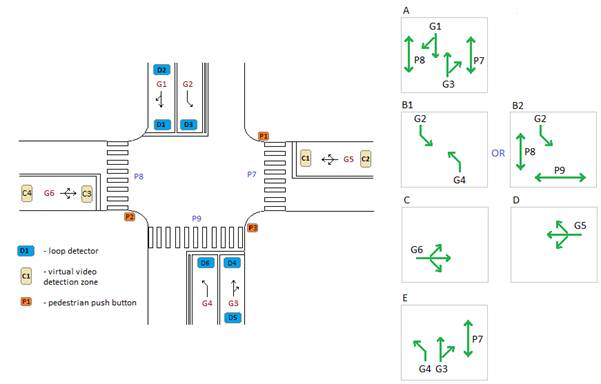
Figure 291: Intersection layout
The Stage Sequence contains both main and alternative stages (A, B1, B2, C, D and E).
18.2 Step 1 Intersection layout
First switch the graphical mode and type the intersection name, Backplane ID, number of signal groups, plans etc.
See: Quick Start View button section 3.5 page 17
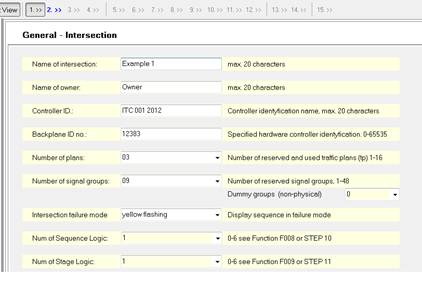
Figure 292: STEP 1
See: STEP 1 - Intersection layout section 4.1 page 18
18.3 Step 2 Signal groups
Click STEP 2 button and decide the signal groups name, type and min group sequence.
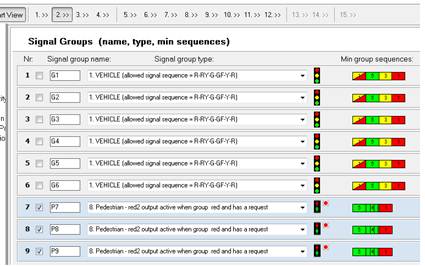
Figure 293: STEP 2
See: STEP 2 - Signal groups section 4.3 page 25
18.4 Step 3 Conflicts
Fill in the intergreen time matrix with the values from the traffic design. Values should always consider the local traffic regulations, speed and distances.
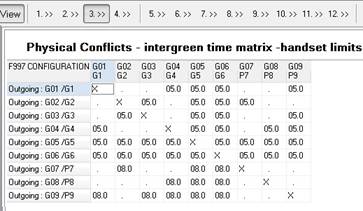
Figure 294: STEP 3
See: STEP 3 - Minimum inter green time matrix section 4.4 page 29
18.5 Step 4 Conflicting group numbers
Table from STEP 4 contains conflicting group numbers
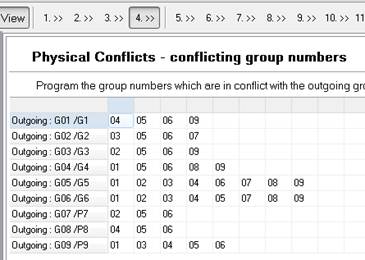
Figure 295: STEP 4
See: STEP 4 - Signal group conflicts section 4.4 page 31
18.6 Step 5 Start-up sequence
Choose start-up sequences from the list - different for the vehicle and pedestrian signal groups.
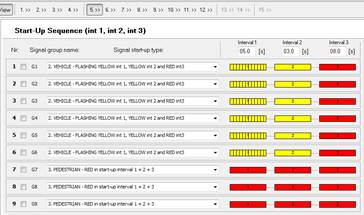
Figure 296: STEP 5
See: STEP 5 - Intersection start-up sequence section 4.6 page 32
18.7 Step 6 General plan programming
Make the signal plans ”isolated type” and decide the star-up and rest stage. To learn more about:
- start-up stage definition see: Start-up stage section 4.7.3 page 34
- rest stage definition see: Rest stage programming section 6.1.1 page 89
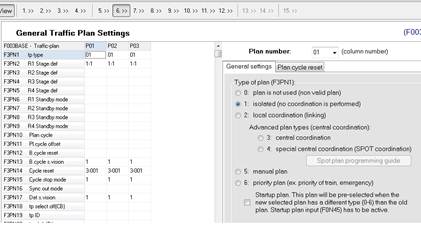
Figure 297: STEP 6
See: STEP 6 - General plan programming section 4.7 page 33
18.8 Step 7 Lamp supervision programming
See: STEP 7 - Lamp supervision section 4.8 page 36
18.9 Step 8 Intergreen time matrix
The Intergreen time marix from STEP 8 usually contains both physical and logical conflicts - more about logical conflicts in section 4.9.2 page 41

Figure 298: STEP 8
See: STEP 8 - Physical and fictive inter green time matrix section 4.9 page 40
18.10 Step 9 General plan programming
The plan drawing represents the traffic design. If your traffic design contains only the tabular representation of the green times, you can draw it on your own here in STEP 9. When the drawing plan structure in STEP 9, consider both the green times and stage sequence.
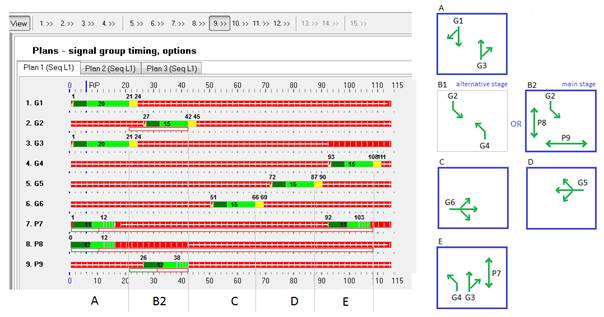
Figure 299: STEP 9
Here you should consider the main stages only. Don’t draw any alternative stages here. How it is decided that the stage B2 is a main stage and the B1 is an alternative one?
Simply, if we made the B1 main stage then groups P8 and P9 would never get green as these groups don’t belong to any other stage but only to B2. That is why the B2 stage is a main stage. And only if the P8 either P9 is not requesting, controller can create the alternative stage B1, with the left turn G4 green two times, in stage B1 and E2.
See: STEP 9 - Traffic plans programming section 4.10 page 43
18.11 Step 11 Stage sequence
The Stage Sequence usually contains programming for main stages only. You don’t have to program the alternative stages here. Alternative stages will be created by the controller auto- matically, following some additional rules programmed in the Detector Logic.
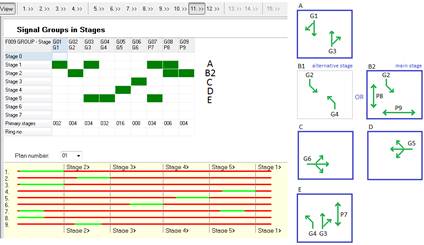
Figure 300: STEP 11
See: STEP 11 - Stage logic programming section 4.12 page 55
18.12 Step 13 Loop detector hardware programming
The software generates the default loop detector hardware programming.
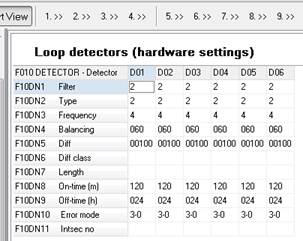
Figure 301: STEP 13
See: STEP 13 - Loop detectors section 5.1 page 66
18.13 Step 14 Detector Logic
The Detector Logic programming links loop and video detectors with vehicle groups:
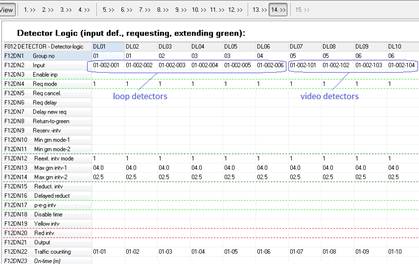
Figure 302: STEP 14 - loop detectors and digital inputs
The Detector Logic programming links the push button inputs with pedestrian signal groups:
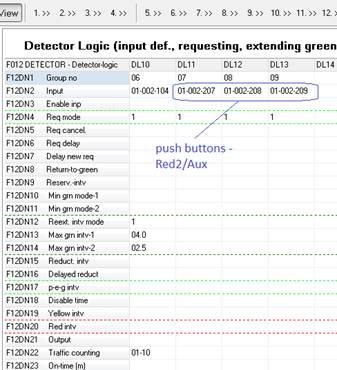
Figure 303: STEP 14 - push buttons
See: STEP 14 - Detector Logics section 5.2 page 68
18.14 Step 10 Sequence Logic programming
Press the ”vehicle actuated” button and change the default fixed time settings to vehicle ac- tuated.

Figure 304: STEP 10
You can also add Sequence Logic in STEP 1, make it fixed time plan and associate with Plan 3. This way first two plans would remains vehicle actuated and the last one fixed time plan (back up plan).
|
|
|
|
|
Дата добавления: 2014-12-23; Просмотров: 924; Нарушение авторских прав?; Мы поможем в написании вашей работы!