КАТЕГОРИИ:
Архитектура-(3434)Астрономия-(809)Биология-(7483)Биотехнологии-(1457)Военное дело-(14632)Высокие технологии-(1363)География-(913)Геология-(1438)Государство-(451)Демография-(1065)Дом-(47672)Журналистика и СМИ-(912)Изобретательство-(14524)Иностранные языки-(4268)Информатика-(17799)Искусство-(1338)История-(13644)Компьютеры-(11121)Косметика-(55)Кулинария-(373)Культура-(8427)Лингвистика-(374)Литература-(1642)Маркетинг-(23702)Математика-(16968)Машиностроение-(1700)Медицина-(12668)Менеджмент-(24684)Механика-(15423)Науковедение-(506)Образование-(11852)Охрана труда-(3308)Педагогика-(5571)Полиграфия-(1312)Политика-(7869)Право-(5454)Приборостроение-(1369)Программирование-(2801)Производство-(97182)Промышленность-(8706)Психология-(18388)Религия-(3217)Связь-(10668)Сельское хозяйство-(299)Социология-(6455)Спорт-(42831)Строительство-(4793)Торговля-(5050)Транспорт-(2929)Туризм-(1568)Физика-(3942)Философия-(17015)Финансы-(26596)Химия-(22929)Экология-(12095)Экономика-(9961)Электроника-(8441)Электротехника-(4623)Энергетика-(12629)Юриспруденция-(1492)Ядерная техника-(1748)
Stable cobweb
|
|
|
|
Cobweb theorem as an illustration of stable and unstable equilibrium
Equilibrium and Government regulation of a market
Lecture 3
Cobweb is a simple model used to illustrate the danger that time lags may introduce fluctuations into the economy. It was created by Hungarian-born economist Nicholas Kaldor (1908-1986).
This simple dynamic model of cyclical demand with time lags between the response of production and a change in price (most often seen in agricultural sectors). Cobweb theory is the process of adjustment in markets.
It traces the path of prices and outputs in different equilibrium situations. Path resembles a cobweb with the equilibrium point at the center of the cobweb.
Hypothesis:
– have a perfectly competitive market
– production period is long
– the price is determined by contemporary production
– quantity supplied is determined by contemporary price
Model can be illustrated with the help of the following graphs:
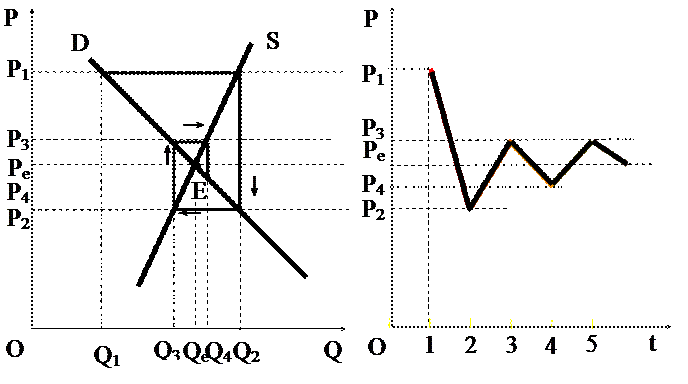
| Period (day) | Current price | Quantity demanded | Quantity supplied | shortage/ surplus | Next period (day) price |
| I | P1 | Q1 | Q2 | surplus | P2 |
| II | P2 | Q2 | Q3 | shortage | P3 |
| III | P3 | Q3 | Q4 | surplus | P4 |
| IV | P4 | Q4 | Qn | shortage | Pn |
| V | … | … | … | … | … |
EXPLANATION: Assume that this represents the market for X-good. The current price is Pe and quantity bought and sold Qe.
Assume that prise rises from Pe to P1. At the current market price of Pe there will be a surplus created – buyers cannot easily increase the demand of X-good in the short run. This would cause the price to fall (P2). The lower price encourages consumers to buy more goods – the damand at the end of the period will increase to Q2.
The increased demand at a price of P2 however is met with a reduction in quantity supplied. It means that there is shortage in the market. As a result the price increases to P3 level.
The higher price persuades produsers to increase production quantity for the next period (Q4).
At P3 the lower demand means a surplus is created press the price down to P4. This will encourage buyers to expand consumption to Q4. …
This process will continue until the price reaches equilibrium. This is termed a ‘convergent cobweb’. A convergent cobweb leads to price stability over time.
|
|
|
|
|
Дата добавления: 2014-01-11; Просмотров: 649; Нарушение авторских прав?; Мы поможем в написании вашей работы!