КАТЕГОРИИ:
Архитектура-(3434)Астрономия-(809)Биология-(7483)Биотехнологии-(1457)Военное дело-(14632)Высокие технологии-(1363)География-(913)Геология-(1438)Государство-(451)Демография-(1065)Дом-(47672)Журналистика и СМИ-(912)Изобретательство-(14524)Иностранные языки-(4268)Информатика-(17799)Искусство-(1338)История-(13644)Компьютеры-(11121)Косметика-(55)Кулинария-(373)Культура-(8427)Лингвистика-(374)Литература-(1642)Маркетинг-(23702)Математика-(16968)Машиностроение-(1700)Медицина-(12668)Менеджмент-(24684)Механика-(15423)Науковедение-(506)Образование-(11852)Охрана труда-(3308)Педагогика-(5571)Полиграфия-(1312)Политика-(7869)Право-(5454)Приборостроение-(1369)Программирование-(2801)Производство-(97182)Промышленность-(8706)Психология-(18388)Религия-(3217)Связь-(10668)Сельское хозяйство-(299)Социология-(6455)Спорт-(42831)Строительство-(4793)Торговля-(5050)Транспорт-(2929)Туризм-(1568)Физика-(3942)Философия-(17015)Финансы-(26596)Химия-(22929)Экология-(12095)Экономика-(9961)Электроника-(8441)Электротехника-(4623)Энергетика-(12629)Юриспруденция-(1492)Ядерная техника-(1748)
Summarise the information by selecting and reporting the main features, and make comparisons where relevant
|
|
|
|
3.
The table below presents the number of children ever born to women aged 40-44 years in Australia for each year the information was collected since 1981.
| Number of children ever born, Women aged 40–44 years | |||||
| Four or | |||||
| One | Two | Three | more | ||
| None | child | children | children | children | |
| year | % | % | % | % | % |
| 15.9 | 13.2 | 38.3 | 21.5 | 11.0 | |
| 12.8 | 11.3 | 38.2 | 24.6 | 13.1 | |
| 9.7 | 8.7 | 35.6 | 27.0 | 18.9 | |
| 8.5 | 7.6 | 29.0 | 27.4 | 27.6 |
The table shows some information on the number of children born to women aged 40-44 in Australia. The data are available for 2006, 1996, 1986 and 1981.
As an overall trend, it can be clearly seen that the number of children born to the aged women rose with the time in families with one and two children and decreased in families with three and four or more children. The figures for one child families experienced the most significant growth almost twice from 7.6% in 1981 to 13.2% in 2006. As it is shown by the table, over the time of the study the figures for women with four and more children fell considerably by about two thirds from 27.6% in 1981 to just 11.0% in 2006.
It is interesting to note that aged women with three and four or more children had nearly the same figures back in 1981 and they were 27.4% and 27.6% respectively. However, in 2006 the figures for the former exceeded the latter’s ones almost twice and were 21.5% in comparison with only 11.0% respectively.
***
The table shows some information on the number of children born to women aged 40-44 in Australia. The data are available for 2006, 1996, 1986 and 1981.
As an overall trend, it can be clearly seen that the number of children born to the agedwomen rose with the time in families with one and two children and decreased in families with three and four or more children. The figures for one child families experienced the most significant growth almost twice from 7.6% in 1981 to 13.2% in 2006. As it is shown by the table, over the time of the study the figures for women with four and more children fell considerably by about two thirds from 27.6% in 1981 to just 11.0% in 2006.
It is interesting to note that aged women with three and four or more children had nearly the same figures back in 1981 and they were 27.4% and 27.6% respectively. However, in 2006 the figures for the former exceeded the latter’s ones almost twice and were 21.5% in comparison with only 11.0% respectively.
4.
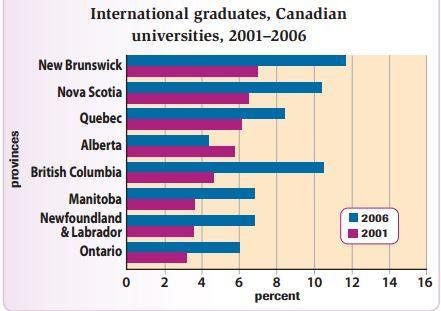
The bar chart shows some information on the proportion of overseas students among university graduates in Canadian provinces. Eight provinces are listed. The data are available for 2001 and 2006.
As an overall trend, it can be clearly seen that the share of international students in New Brunswick was by far the largest among all the provinces during the whole period of the study. Its figure was about 7% in 2001 and then rose almost twice to about 12% in 2006.
It is interesting to note that Nova Scotia’s share of overseas graduates exceeded that one of British Columbia by about a third in 2001 and figures for them were around 6% and 4% respectively. However, in the year 2006 the figures for them were equal and came to just over 10%.
As it is shown by the chart, the portions of international students experienced an increase in all the provinces with the time.
***
The bar chart shows some information on the proportion of overseas students among university graduates in Canadian provinces. Eight provinces are listed. The data are available for 2001 and 2006.
As an overall trend, it can be clearly seen that the share of international students in New Brunswick was by far the largest among all the provinces during the whole period of the study. Its figure was about 7% in 2001 and then rose almost twice to about 12% in 2006.
It is interesting to note that Nova Scotia ’s share of overseas graduates exceeded that one of British Columbia by about a third in 2001 and figures for them were around 6% and 4% respectively. However, in the year 2006 the figures for them were equal and came to just over 10%.
As it is shown by the chart, the portions of international students experienced an increase in all the provinces with the time.
|
|
|
|
|
Дата добавления: 2015-06-25; Просмотров: 626; Нарушение авторских прав?; Мы поможем в написании вашей работы!