КАТЕГОРИИ:
Архитектура-(3434)Астрономия-(809)Биология-(7483)Биотехнологии-(1457)Военное дело-(14632)Высокие технологии-(1363)География-(913)Геология-(1438)Государство-(451)Демография-(1065)Дом-(47672)Журналистика и СМИ-(912)Изобретательство-(14524)Иностранные языки-(4268)Информатика-(17799)Искусство-(1338)История-(13644)Компьютеры-(11121)Косметика-(55)Кулинария-(373)Культура-(8427)Лингвистика-(374)Литература-(1642)Маркетинг-(23702)Математика-(16968)Машиностроение-(1700)Медицина-(12668)Менеджмент-(24684)Механика-(15423)Науковедение-(506)Образование-(11852)Охрана труда-(3308)Педагогика-(5571)Полиграфия-(1312)Политика-(7869)Право-(5454)Приборостроение-(1369)Программирование-(2801)Производство-(97182)Промышленность-(8706)Психология-(18388)Религия-(3217)Связь-(10668)Сельское хозяйство-(299)Социология-(6455)Спорт-(42831)Строительство-(4793)Торговля-(5050)Транспорт-(2929)Туризм-(1568)Физика-(3942)Философия-(17015)Финансы-(26596)Химия-(22929)Экология-(12095)Экономика-(9961)Электроника-(8441)Электротехника-(4623)Энергетика-(12629)Юриспруденция-(1492)Ядерная техника-(1748)
The California Test Score Data Set
|
|
|
|
Review of Probability and Statistics
This course is about using data to measure causal effects.
Brief Overview of the Course
The statistical analysis of economic (and related) data
Introduction to Econometrics
Economics suggests important relationships, often with policy implications, but virtually never suggests quantitative magnitudes of causal effects.
· What is the quantitative effect of reducing class size on student achievement?
· How does another year of education change earnings?
· What is the price elasticity of cigarettes?
· What is the effect on output growth of a 1 percentage point increase in interest rates by the Fed?
· What is the effect on housing prices of environmental improvements?
· Ideally, we would like an experiment
o what would be an experiment to estimate the effect of class size on standardized test scores?
· But almost always we only have observational (nonexperimental) data.
o returns to education
o cigarette prices
o monetary policy
· Most of the course deals with difficulties arising from using observational to estimate causal effects
o confounding effects (omitted factors)
o simultaneous causality
o “correlation does not imply causation”
In this course you will:
· Learn methods for estimating causal effects using observational data
· Learn some tools that can be used for other purposes, for example forecasting using time series data;
· Focus on applications – theory is used only as needed to understand the “why”s of the methods;
· Learn to evaluate the regression analysis of others – this means you will be able to read/understand empirical economics papers in other econ courses;
· Get some hands-on experience with regression analysis in your problem sets.
(SW Chapters 2, 3)
Empirical problem: Class size and educational output
· Policy question: What is the effect on test scores (or some other outcome measure) of reducing class size by one student per class? by 8 students/class?
· We must use data to find out (is there any way to answer this without data?)
All K-6 and K-8 California school districts (n = 420)
Variables:
· 5PthP grade test scores (Stanford-9 achievement test, combined math and reading), district average
· Student-teacher ratio (STR) = no. of students in the district divided by no. full-time equivalent teachers
Initial look at the data:
(You should already know how to interpret this table)
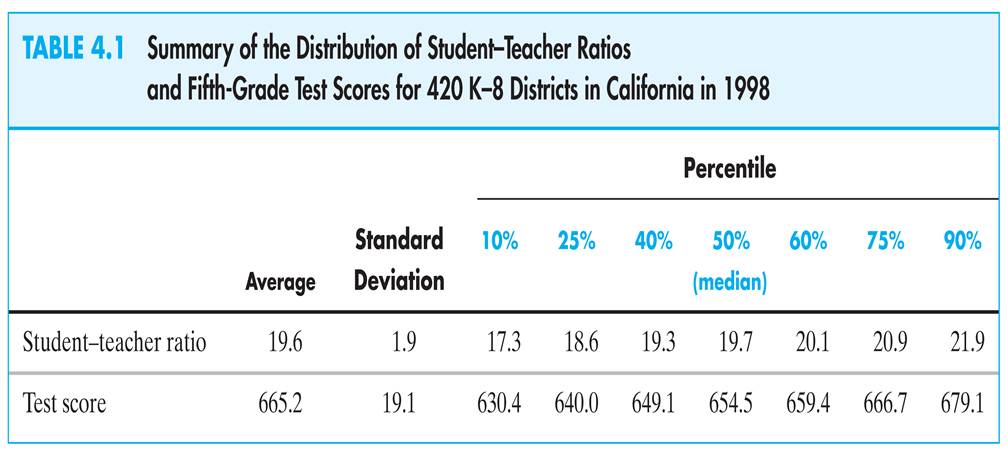
This table doesn’t tell us anything about the relationship between test scores and the STR.
Do districts with smaller classes have higher test scores?
Scatterplot of test score v. student-teacher ratio
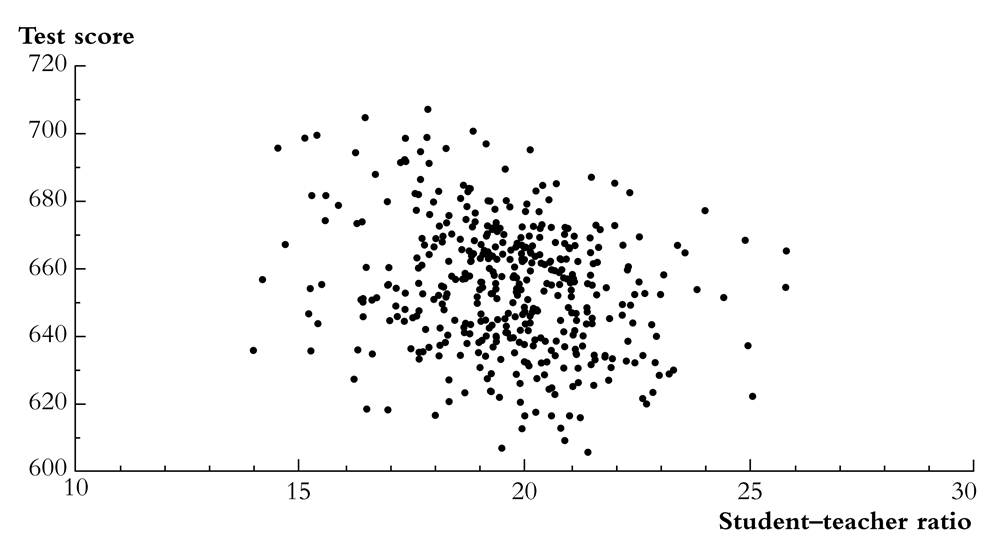
what does this figure show?
We need to get some numerical evidence on whether districts with low STRs have higher test scores – but how?
1. Compare average test scores in districts with low STRs to those with high STRs (“ estimation ”)
2. Test the “null” hypothesis that the mean test scores in the two types of districts are the same, against the “alternative” hypothesis that they differ (“ hypothesis testing ”)
3. Estimate an interval for the difference in the mean test scores, high v. low STR districts (“ confidence interval ”)
Initial data analysis: Compare districts with “small” (STR < 20) and “large” (STR ≥ 20) class sizes:
| Class Size | Average score ( ) )
| Standard deviation (s B Y B) | n |
| Small | 657.4 | 19.4 | |
| Large | 650.0 | 17.9 |
1. Estimation of D = difference between group means
2. Test the hypothesis that D = 0
3. Construct a confidence interval for D
|
|
|
|
|
Дата добавления: 2014-01-07; Просмотров: 528; Нарушение авторских прав?; Мы поможем в написании вашей работы!