КАТЕГОРИИ:
Архитектура-(3434)Астрономия-(809)Биология-(7483)Биотехнологии-(1457)Военное дело-(14632)Высокие технологии-(1363)География-(913)Геология-(1438)Государство-(451)Демография-(1065)Дом-(47672)Журналистика и СМИ-(912)Изобретательство-(14524)Иностранные языки-(4268)Информатика-(17799)Искусство-(1338)История-(13644)Компьютеры-(11121)Косметика-(55)Кулинария-(373)Культура-(8427)Лингвистика-(374)Литература-(1642)Маркетинг-(23702)Математика-(16968)Машиностроение-(1700)Медицина-(12668)Менеджмент-(24684)Механика-(15423)Науковедение-(506)Образование-(11852)Охрана труда-(3308)Педагогика-(5571)Полиграфия-(1312)Политика-(7869)Право-(5454)Приборостроение-(1369)Программирование-(2801)Производство-(97182)Промышленность-(8706)Психология-(18388)Религия-(3217)Связь-(10668)Сельское хозяйство-(299)Социология-(6455)Спорт-(42831)Строительство-(4793)Торговля-(5050)Транспорт-(2929)Туризм-(1568)Физика-(3942)Философия-(17015)Финансы-(26596)Химия-(22929)Экология-(12095)Экономика-(9961)Электроника-(8441)Электротехника-(4623)Энергетика-(12629)Юриспруденция-(1492)Ядерная техника-(1748)
Confidence intervals, ctd
|
|
|
|
Confidence intervals
Confidence Intervals
A 95% confidence interval for mY is an interval that contains the true value of mY in 95% of repeated samples.
Digression: What is random here? The values of Y 1,…, Yn and thus any functions of them – including the confidence interval. The confidence interval it will differ from one sample to the next. The population parameter, mY, is not random, we just don’t know it.
A 95% confidence interval can always be constructed as the set of values of mY not rejected by a hypothesis test with a 5% significance level.
{ mY:  £ 1.96} = { mY: –1.96 £
  £ 1.96}
= { mY: –1.96 £
£  – mY £ 1.96}
= { mY Î (– 1.96, + 1.96)}
This confidence interval relies on the large-n results that is approximately normally distributed and 

 .
.
Summary:
From the two assumptions of:
(1) simple random sampling of a population, that is,
{ Yi, i =1,…, n } are i.i.d.
(2) 0 < E (Y 4) < ¥
we developed, for large samples (large n):
· Theory of estimation (sampling distribution of )
· Theory of hypothesis testing (large- n distribution of t -statistic and computation of the p -value)
· Theory of confidence intervals (constructed by inverting test statistic)
Are assumptions (1) & (2) plausible in practice? Yes
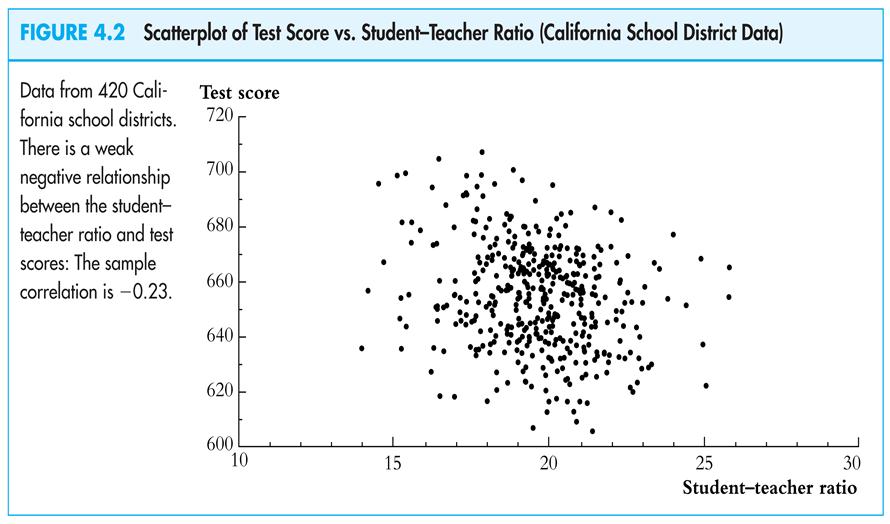
Let’s go back to the original policy question:
What is the effect on test scores of reducing STR by one student/class?
Have we answered this question?
|
|
|
|
Дата добавления: 2014-01-07; Просмотров: 310; Нарушение авторских прав?; Мы поможем в написании вашей работы!