КАТЕГОРИИ:
Архитектура-(3434)Астрономия-(809)Биология-(7483)Биотехнологии-(1457)Военное дело-(14632)Высокие технологии-(1363)География-(913)Геология-(1438)Государство-(451)Демография-(1065)Дом-(47672)Журналистика и СМИ-(912)Изобретательство-(14524)Иностранные языки-(4268)Информатика-(17799)Искусство-(1338)История-(13644)Компьютеры-(11121)Косметика-(55)Кулинария-(373)Культура-(8427)Лингвистика-(374)Литература-(1642)Маркетинг-(23702)Математика-(16968)Машиностроение-(1700)Медицина-(12668)Менеджмент-(24684)Механика-(15423)Науковедение-(506)Образование-(11852)Охрана труда-(3308)Педагогика-(5571)Полиграфия-(1312)Политика-(7869)Право-(5454)Приборостроение-(1369)Программирование-(2801)Производство-(97182)Промышленность-(8706)Психология-(18388)Религия-(3217)Связь-(10668)Сельское хозяйство-(299)Социология-(6455)Спорт-(42831)Строительство-(4793)Торговля-(5050)Транспорт-(2929)Туризм-(1568)Физика-(3942)Философия-(17015)Финансы-(26596)Химия-(22929)Экология-(12095)Экономика-(9961)Электроника-(8441)Электротехника-(4623)Энергетика-(12629)Юриспруденция-(1492)Ядерная техника-(1748)
Using probability distributions to measure risk
|
|
|
|
Risk
For example, you buy a share of common stock in any company and hold it for one year. The cash dividend that you anticipate receiving may or may not materialize as expected. And, what is more, the year-end price of the stock might be much lower than expected—maybe even less than you started with. Thus, your actual return on this investment may differ substantially from your expected return. If we define risk as the variability of returns from those that are expected, the T-bill would be a risk-free security while the common stock would be a risky security. The greater the variability, the riskier the security is said to be.
As we have just noted, for all except risk-free securities the return we expect may be different from the return we receive. For risky securities, the actual rate of return can be viewed as a random variable (случайная величина) subject to a probability distribution (распределение вероятностей). Suppose, for example, that an investor believed that the possible one-year returns from investing in a particular common stock were as shown in the shaded section of Table 1, which represents the probability distribution of one-year returns. This probability distribution can be summarized in terms of two parameters of the distribution: (1) the expected return and (2) the standard deviation.
Expected Return and Standard Deviation (среднеквадратичное отклонение -мера (оценка) риска для инвестиций, приносящих случайный доход; чем больше величина стандартного отклонения, тем выше риск)
The expected return (ожидаемый доход), Re, is
Re =Σ (Ri)(Pi) (5)
where Ri is the return for the ith possibility, Pi - is the probability of that return occurring, and n is the total number of possibilities. Thus, the expected return is simply a weighted average (средневзвешенная) of the possible returns, with the weights being the probabilities of occurrence (случай). For the distribution of possible returns shown in Table 1, the expected return is shown to be 9 %.
TABLE 1. Illustration of the use of probability distribution of possible one year returns to calculate expected return and standard deviation
| Possible return Ri | Probability of occurrence Pi | Expected return calculation Re | Variance calculationσ2 |
| (Ri)(Pi) | (Ri-Re)2(Pi) | ||
| -0.1 | 0.05 | -0.005 | (-0.1-0.09)2*0.05 |
| -0.02 | 0.1 | -0.002 | (-0.02-0.09)2*0.1 |
| 0.04 | 0.2 | 0.008 | (0.04-0.09)2*0.2 |
| 0.09 | 0.3 | 0.027 | (0.09-0.09)2*0.03 |
| 0.14 | 0.2 | 0.028 | (0.14-0.09)2*0.2 |
| 0.2 | 0.1 | 0.02 | (0.0-0.09)2*0.1 |
| 0.28 | 0.05 | 0.014 | (0.28-0.09)2*0.05 |
| Σ=1.00 | Σ=0.09=Re | Σ=0.00703= σ2 | |
| Standard deviation = (0.00703)0.5=0.0838= σ | |||
To complete the two-parameter description of our return distribution, we need a measure of the dispersion (дисперсия, разброс), or variability (вариабельность, изменчивость), around our expected return. The conventional measure of dispersion is the standard deviation. The greater the standard deviation of returns, the greater the variability of returns, and the greater the risk of the investment. The standard deviation, σ, can be expressed mathematically as
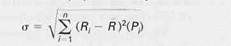 (6) (6)
|
The square of the standard deviation, σ2, is known as the variance of the distribution (вариации распределения вероятностей). Operationally, we generally first calculate a distribution's variance, or the weighted average (средневзвешенная) of squared deviations (квадратичное отклонение) of possible of occurrence. Then, the square root of this figure provides us with the standard deviation. Table 1 reveals our example distribution's variance to be 0.00703. Taking the square root of this value, we find that the distribution's standard deviation is 8.38 %.
|
|
|
|
Дата добавления: 2014-01-11; Просмотров: 1355; Нарушение авторских прав?; Мы поможем в написании вашей работы!