КАТЕГОРИИ:
Архитектура-(3434)Астрономия-(809)Биология-(7483)Биотехнологии-(1457)Военное дело-(14632)Высокие технологии-(1363)География-(913)Геология-(1438)Государство-(451)Демография-(1065)Дом-(47672)Журналистика и СМИ-(912)Изобретательство-(14524)Иностранные языки-(4268)Информатика-(17799)Искусство-(1338)История-(13644)Компьютеры-(11121)Косметика-(55)Кулинария-(373)Культура-(8427)Лингвистика-(374)Литература-(1642)Маркетинг-(23702)Математика-(16968)Машиностроение-(1700)Медицина-(12668)Менеджмент-(24684)Механика-(15423)Науковедение-(506)Образование-(11852)Охрана труда-(3308)Педагогика-(5571)Полиграфия-(1312)Политика-(7869)Право-(5454)Приборостроение-(1369)Программирование-(2801)Производство-(97182)Промышленность-(8706)Психология-(18388)Религия-(3217)Связь-(10668)Сельское хозяйство-(299)Социология-(6455)Спорт-(42831)Строительство-(4793)Торговля-(5050)Транспорт-(2929)Туризм-(1568)Физика-(3942)Философия-(17015)Финансы-(26596)Химия-(22929)Экология-(12095)Экономика-(9961)Электроника-(8441)Электротехника-(4623)Энергетика-(12629)Юриспруденция-(1492)Ядерная техника-(1748)
C5 Verifying the true cause
|
|
|
|
C4 Testing the most probable cause
C3 Establishing possible causes
C2 Describing the problem
C1 Defining the problem
Because the investigation is based on the definition of the problem, this definition has to state precisely which deviation(s) from the agreed service level s have occurred.
Often, during the definition of a problem, the most likely problem cause is already indicated. Take care not to jump to conclusions, which can guide the investigation in the wrong direction from the beginning.
In practice, problem definition is often a difficult task because of a complicated IT Infrastructure and non-transparent agreement s on service levels
The following aspects are used to describe the problem, i.e. what the problem IS:
- Identity. Which part does not function well? What is the problem?
- Location. Where does the problem occur?
- Time. When did the problem start to occur? How frequently has the problem occurred?
- Size. What is the size of the problem? How many parts are affected?
The ‘IS’ situation is determined by the answers to these questions. The next step is to investigate which similar parts in a similar environment are functioning properly. With this, an answer is formulated to the question ‘What COULD BE but IS NOT?’ (Which parts could be showing the same problem but do not?).
It is then possible to search effectively for relevant differences in both situations. Furthermore, past changes, which could be the cause of these differences, can be identified
The list of differences and changes mentioned above most likely hold the cause of the problem so possible causes can be extracted from this list.
Each possible cause needs to be assessed to determine whether it could be the cause of all the symptoms of the problem.
The remaining possible causes have to be verified as being the source of the problem. This can only be done by proving this in one way or another – for example by implementing a change or replacing a part. Address the possible causes that can be verified quickly and simply first
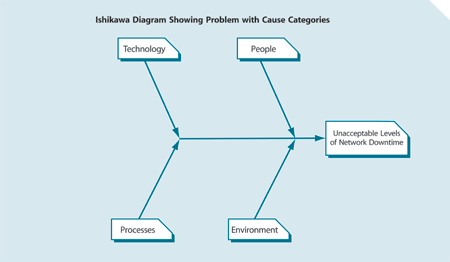
Appendix D: Ishikawa Diagrams
The Ishikawa Diagram, also known as the Fishbone, Cause-and-Effect or Tree Diagram, is a tool used for systematically identifying and presenting all the possible causes of a particular problem on a chart. The technique is named after its developer, Kaoru Ishikawa (1915–89), a leader in Japanese quality control. An example is shown below.
The main goal is represented by the spine or trunk of the diagram and primary factors are represented as branches. Secondary factors are then added as stems, and so on. Creating the diagram stimulates discussion and often leads to increased understanding of a complex problem. These diagrams are extensively used in identifying solutions to systemic problems, such as identifying the cause of productivity loss on assembly lines, or lower customer satisfaction levels in a service organization.
The basic technique of developing these diagrams, together with a very simple example, is shown here. A problem solving team will use the Ishikawa Diagram as follows:
- 1.- Prepare a blank diagram in a format that can be viewed by the entire group. This could be a flipchart, board, projected through a data projector from a PC, etc.
- 2.- Define the problem that the group is trying to solve in clear and specific terms and write it in the box at the ‘fish head’ box of the diagram.
- 3.- Write the cause categories into the tips of the ‘fish bones’. These should be fairly broad categories as the exact causes are not yet known. An example is shown in Figure D.1 in which the group is trying to find the cause for unacceptable levels of network downtime.
|
|
|
|
|
Дата добавления: 2014-12-23; Просмотров: 417; Нарушение авторских прав?; Мы поможем в написании вашей работы!