КАТЕГОРИИ:
Архитектура-(3434)Астрономия-(809)Биология-(7483)Биотехнологии-(1457)Военное дело-(14632)Высокие технологии-(1363)География-(913)Геология-(1438)Государство-(451)Демография-(1065)Дом-(47672)Журналистика и СМИ-(912)Изобретательство-(14524)Иностранные языки-(4268)Информатика-(17799)Искусство-(1338)История-(13644)Компьютеры-(11121)Косметика-(55)Кулинария-(373)Культура-(8427)Лингвистика-(374)Литература-(1642)Маркетинг-(23702)Математика-(16968)Машиностроение-(1700)Медицина-(12668)Менеджмент-(24684)Механика-(15423)Науковедение-(506)Образование-(11852)Охрана труда-(3308)Педагогика-(5571)Полиграфия-(1312)Политика-(7869)Право-(5454)Приборостроение-(1369)Программирование-(2801)Производство-(97182)Промышленность-(8706)Психология-(18388)Религия-(3217)Связь-(10668)Сельское хозяйство-(299)Социология-(6455)Спорт-(42831)Строительство-(4793)Торговля-(5050)Транспорт-(2929)Туризм-(1568)Физика-(3942)Философия-(17015)Финансы-(26596)Химия-(22929)Экология-(12095)Экономика-(9961)Электроника-(8441)Электротехника-(4623)Энергетика-(12629)Юриспруденция-(1492)Ядерная техника-(1748)
Graphics and design
|
|
|
|
KEY INFORMATION SECTION 3
| 
| 
|
Computer graphics are graphics created using computers and, more generally, the representation and manipulation of pictorial data by a computer.
The development of computer graphics, or simply referred to as CG, has made computers easier to interact with, and better for understanding and interpreting many types of data. Developments in computer graphics have had a profound impact on many types of media and have revolutionized the animation and video game industry.
In computer graphics, graphics software or image editing software is a program or collection of programs that enable a person to manipulate visual images on a computer.
Computer graphics can be classified into two distinct categories: raster graphics and vector graphics.

| A raster graphics image or bitmap is a data structure representing a generally rectangular grid of pixels, or points of color, viewable via a monitor, paper, or other display medium. Raster images are stored in image files with varying formats. |
A bitmap corresponds bit-for-bit with an image displayed on a screen, generally in the same format used for storage in the display's video memory, or maybe as a device-independent bitmap. A bitmap is technically characterized by the width and height of the image in pixels and by the number of bits per pixel (a color depth, which determines the number of colors it can represent).
The printing and prepress industries know raster graphics as contones (from "continuous tones") and refer to vector graphics as "line work".
Raster graphics are resolution dependent. They cannot scale up to an arbitrary resolution without loss of apparent quality. 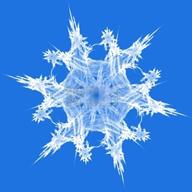
This property contrasts with the capabilities of vector graphics, which easily scale up to the quality of the device rendering them. Raster graphics deal more practically than vector graphics with photographs and photo-realistic images, while vector graphics often serve better for typesetting or for graphic design. Modern computer-monitors typically display about 72 to 130 pixels per inch (PPI), and some modern consumer printers can resolve 2400 dots per inch (DPI) or more; determining the most appropriate image resolution for a given printer-resolution can pose difficulties, since printed output may have a greater level of detail than a viewer can discern on a monitor. Typically, a resolution of 150 to 300 pixel per inch works well for 4-color process (CMYK) printing.
Vector graphics is the use of geometrical primitives such as points, lines, curves, and shapes or polygon(s), which are all based on mathematical equations, to represent images in computer graphics. Vector graphics files store the lines, shapes and colours that make up an image as mathematical formulae. A vector graphics program uses these mathematical formulae to construct the screen image, building the best quality image possible, given the screen resolution. The mathematical formulae determine where the dots that make up the image should be placed for the best results when displaying the image. Since these formulae can produce an image scalable to any size and detail, the quality of the image is only determined by the resolution of the display, and the file size of vector data generating the image stays the same. Printing the image to paper will usually give a sharper, higher resolution output than printing it to the screen but can use exactly the same vector data file. They are ideal for high-resolution output.
 Many graphics programs focus exclusively on either vector or raster graphics, but there are a few that combine them in interesting and sometimes unexpected ways. It is simple to convert from vector graphics to raster graphics, but going the other way is harder. Some software attempts to do this.
Most graphics programs don’t have the ability to import and export one or more graphics file formats.
There are different types of graphics software.
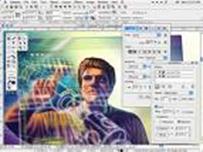
Image manipulation programs let you edit your favourite images. In digital editing, photographs are usually taken with a digital camera and input directly into a computer. Transparencies, negatives or printed photographs may also be digitized using a scanner, or images may be obtained from stock photography databases. With the advent of computers, graphics tablets, and digital cameras, the term image editing encompasses everything that can be done to a photo, whether in a darkroom or on a computer.
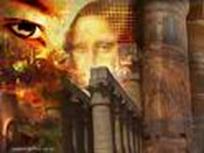
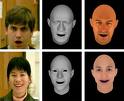
 Photo manipulation is often much more explicit than subtle alterations to color balance or contrast and may involve overlaying a head onto a different body or changing a sign's text, for example. Image editing software gives an opportunity to add different effects, or filters and warp an image until the desired result is achieved. The resulting image may have little or no resemblance to the photo (or photos in the case of compositing) from which it originated. Today, photo manipulation is widely accepted as an art-form.
 Painting and drawing programs, also called illustration packages, offer facilities for freehand drawing, with a wide choice of pens and brushes, colours and patterns. One example is Windows Paint.
 Business graphics programs, also called presentation software, let you create pie charts, bar charts and line graphs of all kinds for slide shows and reports. You can import data from a database or spreadsheet to generate the graphs. Presentation software typically includes three major functions: an editor that allows text to be inserted and formatted, a method for inserting and manipulating graphic images and a slide-show system to display the content.
Computer-aided design (CAD) is the use of computer technology for the design of objects, real or virtual. CAD often involves more than just shapes. As in the manual drafting of technical and engineering drawings, the output of CAD often must convey also symbolic information such as
materials, processes, dimensions, and tolerances, according to application-specific conventions.
CAD may be used to design curves and figures in two-dimensional ("2D") space; or curves, surfaces, or solids in three-dimensional ("3D") objects.
CAD is an important industrial art extensively used in many applications, including automotive, shipbuilding, and aerospace industries, industrial and architectural design, prosthetics, and many more. CAD is also widely used to produce computer animation for special effects in movies, advertising and technical manuals.
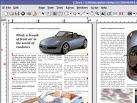 Desktop publishing (DTP) is based around a page layout program, which lets you import text from a word processor, clip-art (ready-made pictures) from graphics packages, and images from scanners or cameras, and arrange them all on a page. It is used to design and publish books, newspapers, posters, advertisements, etc. The term "desktop publishing" is commonly used to describe page layout skills. However, the skills and software are not limited to paper and book publishing. The same skills and software are often used to create graphics for point of sale displays, promotional items, trade show exhibits, retail package designs and outdoor signs.
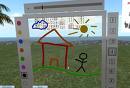
The impact of digital technology has transformed traditional activities such as painting, drawing and sculpture, while new forms, such as net art, digital installation art, and virtual reality, have become recognized artistic practices. More generally the term digital artist is used to describe an artist who makes use of digital technologies in the production of art. In an expanded sense, "digital art" is a term applied to contemporary art that uses the methods of mass production or digital media.
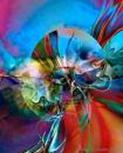
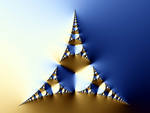 Digital art, or computer art, is done with applets that use mathematical formulae to create beautiful bright shapes called fractals. A fractal is a geometrical figure with special properties. Fractals can also be used to model real objects like clouds, coastlines or landscapes.
 Computer animation (or CGI animation) is the art of creating moving images with the use of computers. It is a subfield of computer graphics and animation. Increasingly it is created by means of 3D computer graphics, though 2D computer graphics are still widely used for stylistic, low bandwidth, and faster real-time rendering needs. Sometimes the target of the animation is the computer itself, but sometimes the target is another medium, such as film. It is also referred to as CGI (computer-generated imagery or computer-generated imaging), especially when used in films.
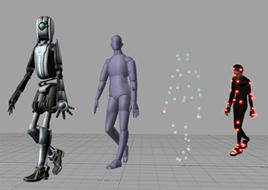 To create the illusion of movement, an image is displayed on the computer screen and repeatedly replaced by a new image that is similar to the previous image, but advanced slightly in the time domain (usually at a rate of 24 or 30 frames/second). Each image in a sequence of images is called a 'frame'. This technique is identical to how the illusion of movement is achieved with television and motion pictures.
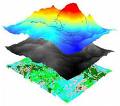 A geographic information system (GIS), or geographical information system captures, stores, analyzes, manages, and presents data that is linked to location. Technically, a GIS is a system which includes mapping software and its application to remote sensing, land surveying, aerial photography, mathematics, photogrammetry, geography, and tools that can be implemented with GIS software.
In the strictest sense, the term describes any information system that integrates, stores, edits, analyzes, shares, and displays geographic information. In a more generic sense, GIS applications are tools that allow users to create interactive queries (user created searches), analyze spatial information, edit data, maps, and present the results of all these operations.
 In simplest terms, GIS is the merging of cartography and database technology. Consumer users would likely be familiar with applications for finding driving directions, like a GPS program on their hand-held device. GPS (Global Positioning System) is the real time location component that uses satellites to show your current position, "where am I now" on your device.
|
|
|
|
|
Дата добавления: 2014-12-27; Просмотров: 1824; Нарушение авторских прав?; Мы поможем в написании вашей работы!