КАТЕГОРИИ:
Архитектура-(3434)Астрономия-(809)Биология-(7483)Биотехнологии-(1457)Военное дело-(14632)Высокие технологии-(1363)География-(913)Геология-(1438)Государство-(451)Демография-(1065)Дом-(47672)Журналистика и СМИ-(912)Изобретательство-(14524)Иностранные языки-(4268)Информатика-(17799)Искусство-(1338)История-(13644)Компьютеры-(11121)Косметика-(55)Кулинария-(373)Культура-(8427)Лингвистика-(374)Литература-(1642)Маркетинг-(23702)Математика-(16968)Машиностроение-(1700)Медицина-(12668)Менеджмент-(24684)Механика-(15423)Науковедение-(506)Образование-(11852)Охрана труда-(3308)Педагогика-(5571)Полиграфия-(1312)Политика-(7869)Право-(5454)Приборостроение-(1369)Программирование-(2801)Производство-(97182)Промышленность-(8706)Психология-(18388)Религия-(3217)Связь-(10668)Сельское хозяйство-(299)Социология-(6455)Спорт-(42831)Строительство-(4793)Торговля-(5050)Транспорт-(2929)Туризм-(1568)Физика-(3942)Философия-(17015)Финансы-(26596)Химия-(22929)Экология-(12095)Экономика-(9961)Электроника-(8441)Электротехника-(4623)Энергетика-(12629)Юриспруденция-(1492)Ядерная техника-(1748)
An example and simulation results
|
|
|
|
Algorithm for roadmap
The block diagram of Sugeno fuzzy control
Based on the developed Sugeno fuzzy algorithm we are going to create a block diagram of the system management of roadmap Figure-5.
Figure-5. the block diagram of fuzzy control
for roadmap.
Initially, the model needs some information to run and show all available paths to reach to the goal, therefore some data were obtained from satellite like the number of gas station through the road to the final goal, traffic state, proportion of congestion of road, determine the proportion of fuel, which is need to reach to goal. Then, when the tank of car needs to fuel to continue the road the model of Sugeno fuzzy control can determine all the paths from source to destination cross to gas stations and then it shows the best path to full the tank of car and reach to destination.
After that, the model asks the driver if wants to determine another destination, if a driver need to reach to another place, then must determine the place on the map, the model takes required data to determine the best path.
Based on above model, the simulation is done. In this simulation Sugeno fuzzy control algorithm works to determine the optimal path for the blue car from the source A to the goal B (Figure-6).
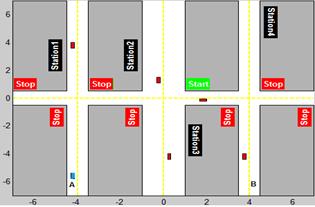
Figure-6. Roadmap with source and destination.
Firstly, the car needs to go to gas station to continue the road to final goal. The program depended on the inputs value and shows all paths the nearest stations to car like in (Figure-7.) There are three paths to reach to goal.
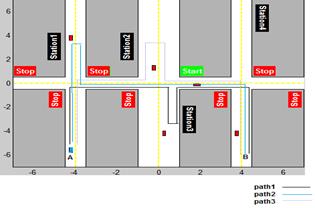
Figure-7. All the paths to reach destination.
Then the program shows the best path in terms of the nearest one to the car, through this path the car arrives to the goal quickly, so the best path to the blue car shows like in (Figure-8).
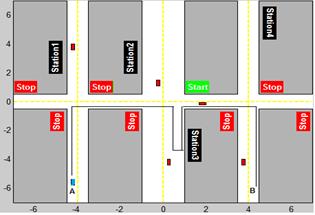
Figure-8. The best paths to reach destination.
We also apply this program with new information such as new source, destination and another road as (Figure-9).
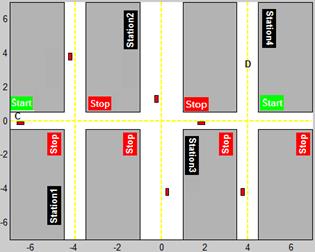
Figure-9. New roadmap with source and destination.
From (Figure-9), the car wants to move from source C to destination D, it needs to fuel from station to continue, the program shows are three paths from C to D, through these paths the car can takes fuel and arrive to the final goal as can see in (Figure-10).
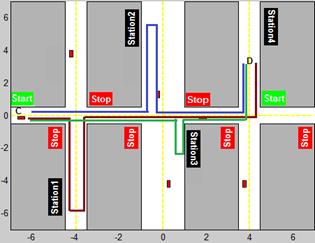
Figure-10. All the paths from source C to destination D.
After that the program appears to a driver of a car the best path to reach final goal D from source C and save the time like in (Figure-11).
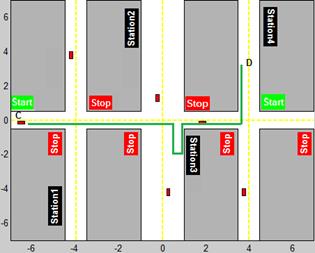
Figure-11. The best paths to reach destination D.
Finally, we give final example to prove the efficient of the program in many roads, so here we suppose that the driver wants to move from source E to final goal F like in (Figure-12).
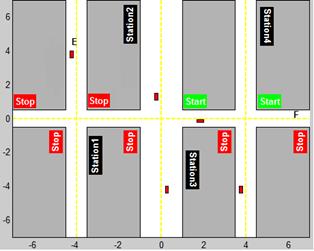
Figure-12. roadmap with source E and destination F.
The program gives the driver many choices of available paths to go to his final goal F from source E and here there are three choices (Figure-13).
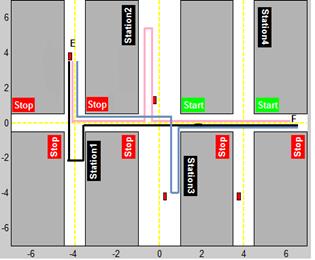
Figure-13. All the paths from source E to destination F.
The program here also gives the driver the optimal path to arrive to destination F (Figure-14).
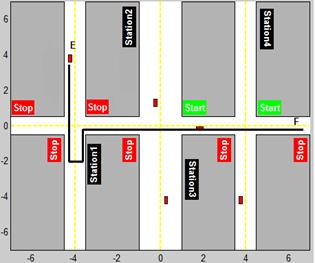
Figure-14. The best paths to reach destination F.
From the three examples above, the Table-1 represents the coordinate of the optimal path for each example.
Table-2. The coordinates of optimal path in examples.
| Source | Destination | Angles/s | Goal/s |
| A | B | 9, 177/16 | 20, 9/90 |
| C | D | 10, 464/18 | 26, 669/107 |
| E | F | 10, 597/21 | 23, 033/100 |
|
|
|
|
|
Дата добавления: 2015-07-02; Просмотров: 247; Нарушение авторских прав?; Мы поможем в написании вашей работы!