КАТЕГОРИИ:
Архитектура-(3434)Астрономия-(809)Биология-(7483)Биотехнологии-(1457)Военное дело-(14632)Высокие технологии-(1363)География-(913)Геология-(1438)Государство-(451)Демография-(1065)Дом-(47672)Журналистика и СМИ-(912)Изобретательство-(14524)Иностранные языки-(4268)Информатика-(17799)Искусство-(1338)История-(13644)Компьютеры-(11121)Косметика-(55)Кулинария-(373)Культура-(8427)Лингвистика-(374)Литература-(1642)Маркетинг-(23702)Математика-(16968)Машиностроение-(1700)Медицина-(12668)Менеджмент-(24684)Механика-(15423)Науковедение-(506)Образование-(11852)Охрана труда-(3308)Педагогика-(5571)Полиграфия-(1312)Политика-(7869)Право-(5454)Приборостроение-(1369)Программирование-(2801)Производство-(97182)Промышленность-(8706)Психология-(18388)Религия-(3217)Связь-(10668)Сельское хозяйство-(299)Социология-(6455)Спорт-(42831)Строительство-(4793)Торговля-(5050)Транспорт-(2929)Туризм-(1568)Физика-(3942)Философия-(17015)Финансы-(26596)Химия-(22929)Экология-(12095)Экономика-(9961)Электроника-(8441)Электротехника-(4623)Энергетика-(12629)Юриспруденция-(1492)Ядерная техника-(1748)
Monopoly Demand and Marginal Revenue
|
|
|
|
Government Grants of Monopoly
Monopolies can be created by legislation. Historically, this has been an important source of monopolies as, for example, a monarch might grant a monopoly of wine to a favorite. In the modern world, governments may still encourage monopoly in many countries of the world, though this seems less common as time goes on.
The demand curve for a monopoly is different from that of a P-Competitive firm. In P-competitive industry, we have to distinguish between the industry demand and the demand for the output of an individual firm, which are quite different. As we recall, the P-competitive firm has a horizontal demand curve. More general, if there are two or more firms in an industry, we have to distinguish between the industry demand and the firm demand. But in a monopoly – an industry with only one firm – there is no such distinction. The demand curve for the monopoly is the demand curve for the industry – since the monopoly controls the output of the entire industry – and the industry demand curve is downward sloping. So the monopoly's demand curve is downward sloping. That means the monopoly can push the price up by limiting output. If the monopoly cuts back on its output, it can move up the industry demand curve to a higher price.
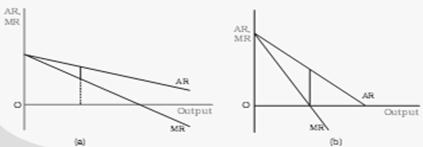
Figure 2 shows that the MR curve lies below the AR curve. We can conclude that if the AR curve (i.e. the demand curve) is falling steeply, the MR curve is far below the AR curve. On the other hand, if the AR curve is less steep, the vertical distance between the AR and MR curves is smaller. Figure 2 (a) shows a flatter AR curve while Figure 2(b)
shows a steeper AR curve. For the same units of the commodity, the difference between AR and MR in panel (a) is smaller than the difference in panel (b).

The MR values have a relation with the price elasticity of demand. It is sufficient to notice only one aspect – price elasticity of demand is more than 1 when the MR has a positive value, and becomes less than the unity when MR has a negative value. As the quantity of the commodity increases, MR value becomes smaller and the value of the price elasticity of demand also becomes smaller. Recall that the demand curve is called elastic at a point where price elasticity is greater than unity, inelastic at a point where the price elasticity is less than unity and unitary elastic when price elasticity is equal to 1.
|
|
|
|
|
Дата добавления: 2014-01-11; Просмотров: 532; Нарушение авторских прав?; Мы поможем в написании вашей работы!