КАТЕГОРИИ:
Архитектура-(3434)Астрономия-(809)Биология-(7483)Биотехнологии-(1457)Военное дело-(14632)Высокие технологии-(1363)География-(913)Геология-(1438)Государство-(451)Демография-(1065)Дом-(47672)Журналистика и СМИ-(912)Изобретательство-(14524)Иностранные языки-(4268)Информатика-(17799)Искусство-(1338)История-(13644)Компьютеры-(11121)Косметика-(55)Кулинария-(373)Культура-(8427)Лингвистика-(374)Литература-(1642)Маркетинг-(23702)Математика-(16968)Машиностроение-(1700)Медицина-(12668)Менеджмент-(24684)Механика-(15423)Науковедение-(506)Образование-(11852)Охрана труда-(3308)Педагогика-(5571)Полиграфия-(1312)Политика-(7869)Право-(5454)Приборостроение-(1369)Программирование-(2801)Производство-(97182)Промышленность-(8706)Психология-(18388)Религия-(3217)Связь-(10668)Сельское хозяйство-(299)Социология-(6455)Спорт-(42831)Строительство-(4793)Торговля-(5050)Транспорт-(2929)Туризм-(1568)Физика-(3942)Философия-(17015)Финансы-(26596)Химия-(22929)Экология-(12095)Экономика-(9961)Электроника-(8441)Электротехника-(4623)Энергетика-(12629)Юриспруденция-(1492)Ядерная техника-(1748)
Гидраты индивидуальных углеводородных и неуглеводородных компонентов. Диаграммы давление – температура систем CH4 + H2O (или N2 + H2O)
|
|
|
|
Диаграммы давление – температура систем CH4 + H2O (или N2 + H2O)
Гидрат метана впервые был получен в 1888 г.
Рассмотрим диаграммы давление – температура для систем CH4 + H2O или N2 + H2O схематически показанные на рисунке при условиях, охватывающих гидратную область.
Так как метан – основной компонент природного газа, эта диаграмма, а также связанная с ней T – x диаграмма обеспечивают понимание всей гидратной области газовых систем, не содержащих жидкую углеводородную фазу.
На диаграммах используются следующие символы:
I – лёд, LW – жидкая вода, H - гидрат, V - пар, и LHC – жидкий углеводород, перечисленные в порядке снижения содержания воды.
Согласно правилу фаз Гиббса, двухкомпонентная система, такая как метан + вода представляется на диаграмме давление – температура как область (для двух фаз), и линией (три фазы) или точкой (четыре фазы).
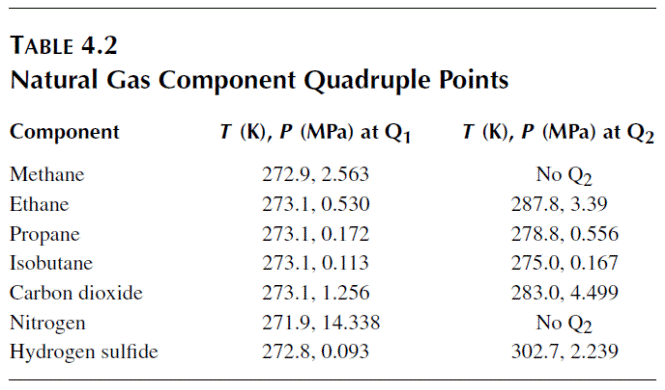
Рассмотрим квадрупольную точку (Q1 ), в которой четыре фазы (I–LW–H–V) сосуществуют. Температура квадрупольной точки приблизительно лежит в окрестности 273,16 K для всех гидратов, однако давления для разных компонентов разнятся более значительно (например, 0.0113 МПа для i-C4H10, 2.56 МПа для CH4, and 14.3 МПа for N2 ). Квадрупольная точка (Q1 ) является стартовой точкой для линий равновесного сосуществования четырёх и трёх фаз:
1. The LW–H–V line has pressure–temperature conditions of the most interest in natural gas systems.
2. The I–H–V line, which has a lower P – T slope than the LW–H–V line. Note that there is a data paucity in the region below 273 K, which is avoided industrially (hence a lack of funding) due to problems with ice formation.
3. The I–LW–H line rises vertically from the quadruple point, with very large pressure changes for small temperature changes, as typified by incompressible phases.
4. The I–LW–V line that connects the quadruple point to the water triple point (I–LW–VW ) (273.16 K, 0.62 kPa), denotes the transition between water and ice without hydrate formation. Since Q1 approximates 273 K for all natural gas systems, the I–LW–V line extends almost vertically below Q1 to 0.62 kPa.
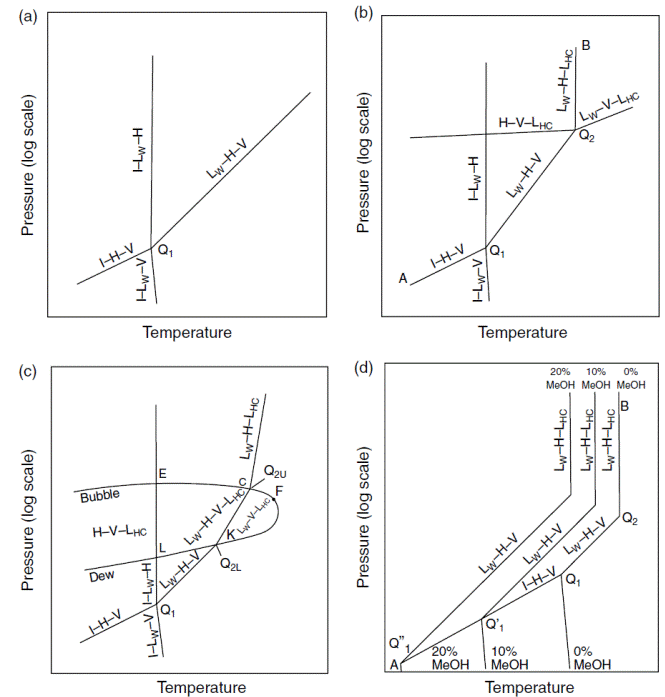
Pressure–temperature diagrams. (a) Methane + water or nitrogen + water system in the hydrate region. (b) Hydrocarbon + water systems with upper quadruple points. (c) Multicomponent natural gas+water systems. (d) Hydrocarbon+water systems with upper quadruple points and inhibitors.
In all of Figure 4.2 note that composition, a third dimension, has been compressed onto the two shown (pressure and temperature), so that the lines shown may project from or into the page.
The equation of Table 4.1 from Kamath (1984) enables prediction of the most common regions of interest of simple natural gas components—the pressure and temperature conditions for both LW–H–V and I–H–V. When using the equation, carefully note the temperature limits. It would be a mistake (for example) to extend the prediction of the LW–H–V region beyond the temperature of either quadruple point Q1 or Q2 (given in Table 4.2), where those three phases cannot exist.
1. The pressures and temperatures of the LW–H–V and the I–H–V lines mark the limits to hydrate formation. At higher temperatures or lower pressures of both lines, hydrate cannot form and the system will contain only aqueous and hydrocarbon fluid phases, while hydrate formation can occur to the left of LW–H–V and I–H–V. Since ice and hydrates both cause flow problems, a gas pipeline rule of thumb is to keep the system temperature above the ice point and to the right of the LW–H–V and the I–H–V lines, or to displace the LW–H–V line below the pipeline operating conditions by injection of a thermodynamic inhibitor such as methanol.
2. The LW–H–V line has no upper pressure or temperature limit because the pure methane (or nitrogen) vapor–liquid critical points (at 191 and 126 K respectively) are far below the quadruple point Q1. Such low critical temperatures prevent intersection of the vapor pressure line with the LW–H–V line above 273 K to produce an upper quadruple point.
3. Similarly, no upper pressure limit to the I–LW–H line has been found. Note that these phases are all incompressible, so that a very large pressure change results from only a small temperature change, in a closed system.
4. The areas between the three-phase lines represent the two-phase region held in common with the bounding three-phase lines. For instance, the area between LW–H–V and I–H–V is the H–V region in which hydrates are in equilibrium only with vapor (water saturated). Similarly, the LW–H two-phase region exists between LW–H–V and I–LW–H lines, and the I–H two-phase region exists between the I–LW–H and I–H–V lines. In this two-dimensional plot the two-phase regions overlap, indicating that the three-phase lines are not all in the plane of the page, but have been compressed into two dimensions, from three, with the third dimension being composition. The compression of the composition axis onto the P – T plane causes the two-phase regions to overlap. Two-phase regions are discussed with T – x diagrams in Section 4.1.5.
5. The diagram schematic is the same for simple hydrate systems of sI (CH4 + H2O) and sII (N2 + H2O) as well as those of fixed natural gas mixture compositions, without a liquid hydrocarbon phase. Systems containing a liquid hydrocarbon are similar in behavior to the
C3H8 + H2O diagram, discussed in Section 4.1.2.
It has been shown (Bansal et al., 1993) that curvature in the LW–H–V line in
Figure 4.2a results if the guest vapor–liquid critical temperature is slightly below
the LW–H–V conditions.
|
|
|
|
|
Дата добавления: 2014-12-17; Просмотров: 500; Нарушение авторских прав?; Мы поможем в написании вашей работы!