КАТЕГОРИИ:
Архитектура-(3434)Астрономия-(809)Биология-(7483)Биотехнологии-(1457)Военное дело-(14632)Высокие технологии-(1363)География-(913)Геология-(1438)Государство-(451)Демография-(1065)Дом-(47672)Журналистика и СМИ-(912)Изобретательство-(14524)Иностранные языки-(4268)Информатика-(17799)Искусство-(1338)История-(13644)Компьютеры-(11121)Косметика-(55)Кулинария-(373)Культура-(8427)Лингвистика-(374)Литература-(1642)Маркетинг-(23702)Математика-(16968)Машиностроение-(1700)Медицина-(12668)Менеджмент-(24684)Механика-(15423)Науковедение-(506)Образование-(11852)Охрана труда-(3308)Педагогика-(5571)Полиграфия-(1312)Политика-(7869)Право-(5454)Приборостроение-(1369)Программирование-(2801)Производство-(97182)Промышленность-(8706)Психология-(18388)Религия-(3217)Связь-(10668)Сельское хозяйство-(299)Социология-(6455)Спорт-(42831)Строительство-(4793)Торговля-(5050)Транспорт-(2929)Туризм-(1568)Физика-(3942)Философия-(17015)Финансы-(26596)Химия-(22929)Экология-(12095)Экономика-(9961)Электроника-(8441)Электротехника-(4623)Энергетика-(12629)Юриспруденция-(1492)Ядерная техника-(1748)
EtherPeek Software Analyzer
|
|
|
|
EtherPeek - a software protocol analyzer, which provides wide ability to monitor and analyze network performance. This analyzerallows obtain the following statistics:
- Statistics on the nodes
- Statistics on the protocols
- Network statistics
- Statistics on the size of the package
- Summary statistics
EtherPeek provides the following capabilities to analyze network:
- Expert analysis of the network in more than one hundred major indicators in the real time;
- Optimum configure of parameters of expert analysis, for everyone
unique case;
- Ability to save the settings;
- Graphical display of movement of packets across the network
the addresses of computers, such as packet protocol (the construction of network maps).
7.2.7.1 The main program window EtherPeek. When you run EtherPeek protocol analyzer opens the main window (Fig. 7.2.12).
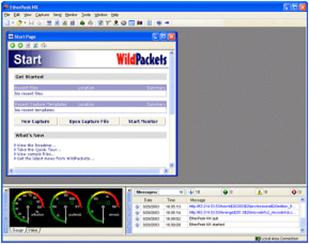
Figure 7.2.12 - The main window of EtherPeek protocol analyzer
In the center of the main window (when starting) starting page will automatically open that allows you to monitor and analyze traffic with the help of which exchanges the local network and externalnetwork. At the bottom of the main window programs are located windows showing statistics of the network (Network Statistics), and displays the message, which produces the program (EtherPeek NX Log). In the upper part of the main window there are drop down menusand toolbar tools.
The File menu allows you to:
- create a new capture window;
- automatically create a new capture window configured inaccordance with user-created patterns;
- create and save patterns settings;
- save the data obtained during the seizure;
- to output the data to the printer.
The Edit menu allows you to:
- copy, paste, cut, delete and add data;
- show / hide the processed and unprocessed packages;
- provide a selection packs (view) protocol, port, size;
- search the specified packages.
The View menu allows you to:
- configure the user interface of the program;
- review existing and add new filters;
- create a “table name” (Name Table) - allows the user todesignate their own symbolic names to addresses, ports and protocols.
Capture menu allows you to:
- initiate a new capture window;
- configure the capture.
Send menu allows you to organize transfer of some or all selected
packages.
Menu Monitor allows you to view general statistics, port statistics, protocols, packet size, on computers.
The Tools menu allows you to adjust common modes of operationof the program, as well as makes it possible to arrange the connection of additional externalmodules.
Window menu lets you adjust the location of windows within the the program main window.
The toolbar contains icons that provide quick start commands of a menu.
7.2.7.2. Capture Window. The main working window of protocol analyzer is the Capture window. Capture window allow you to control the network, as well as to collect statistics. EtherPeek allows you to capture packets in several capture windows simultaneously. At the same time capturing each window can have its individual settings of the capture process. Opening the capturewindow is made of menu Capture, Start Capture option or by clicking the appropriateicon from the toolbar.
|
|
|
When you open the capture window automatically opens capture -settings window Capture options. In the settings capture window you can to produce individual settings of process of capture. The appearance of the settings window is shown in Figure 7.2.13.
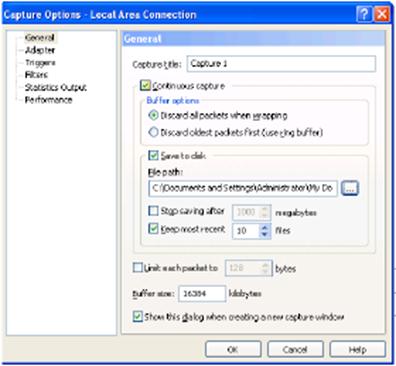
Figure 7.2.13 – The appearance of setting window for capturing process
The Options window has six tabs that allow you to optimally configure the capture window for a certain mode of operation. In the settings window contains the following tabs:
- General - provides the ability to specify the name of the capture window, the size of the buffer cleaning method when filling the buffer, the preservation of datafrom the buffer on the local drive.
- Adapter - provides the ability to choose a network adapter, the package that you want to capture.
- Triggers - provides the ability to adjust the start and stop capture process (setting can be done by time and date and number of captured bytes).
- Filters - provides the ability to attach filters, which provide capture only the packets from those protocols we are interested in, or removal of packets which we're not interested in.
- Statistics Output - provides the ability to configure the storage and display statistics.
- Performance - will adjust the statistics to be, displayed in the capture window.
After you have configured all options capture window will be opened. The Appearance of the capture window is shown in Figure 7.2.14.
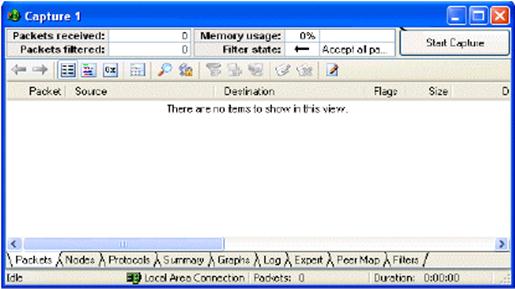
Figure 7.2.14 - The appearance of the capture window
Capture window is divided into two sections - the section of the state and the display section. At the top of the screen of the the capture window there is a button to start / stop of process of capture (Start / Stop Capture) and the status section showing the:
- total number of packets (Packets received),
- the number of packets connected to corresponding filters(Packets Filtered),
- percentage of buffer memory usage,
- direction of the filter action (Filter state).
Below is a section of representation, which contains nine windows whick display the collected statistics in the process of the capture in different ways. Packets window alloy to display statistics on captured packets - the source of the package recipient of the package, packet type, packet length, packet structure, the contents of the package. Nodes window shows statistics on network nodes - node name, the total processed information, the total number of received / transmitted packets, comparison of the symbolic node address to the IP-address, etc. Protocols window shows statistics on protocols - displays the passage of packets to the protocol of the OSI model from the lowest to the highest level.
Summary window displays general statistics since the beginning ofof the capture - the number of involved nodes, the number of packets, the type of pact, length, protocol type, number of errors.
|
|
|
Graphs window alloy to display the statistics obtained in the form of graphs and charts. Log window alloys to display messages from the modules. Window Expert provides expert analysis of packet delay, throughput the ability of the network, possible problems, bugs. Window Peer Map provides a visual display of traffic across the network (building a network map), indicating the amount of information, protocol type etc. (Note: different protocols, packets of different sizes are represented by different colors according to your settings).
Filters window displays all the existing filters, which used for the process of capture, the direction of the filter.
7.2.7.3 Creating a filter. For a detailed analysis of a specific protocol the computer must apply filters. If you do not use filters, then analyzer will capture packets not only on the selected computer (protocol), but also on other computers (protocols). Furthermore, even among selected computers can be passed overheads of the upper levels, which also be captured by the analyzer. As a result, in information obtained in the capture window of the analyzer, it would be difficult understand.
At the EtherPeek analyzer there is a standard set of filters designed to filter the packets of different protocols. You can also create a user filters, for example, to filter packets based MAC-addresses, and IP-addresses of the source and receiver. To create a filter it's necessary in View menu to launch option Filters, will be opened a window that displays the standard set of built-in filters (Figure 7.2.15). At the window that appears, click the button which launches a wizard to create a new filter. The wizard to create filter is
shown in Figure 7.2.16:
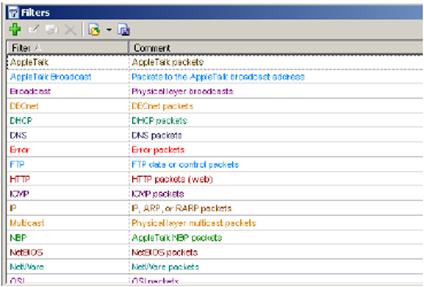
Figure 7.2.15 - Standard set of built-in filters
Enter the filter’s name in the field “Filter”. In the field of Comment leave the comment.
The section of filtration on addresses (Address filter), on protocol (Protocol filter) and on ports (Port filter) locates below. In the section of filtration on addresses the type of address, addresses of computers and similarly direction is noted. In the section of Protocol filter is specified type of protocol the packages of which will be filtered. In section of Port filter is specified the number of port is proper the chosen protocol.
In Figure 7.2.17 the example of creation of filter for ARP-request capturing from computer A is shown.
7.2.7.4 Features of protocol analyzer EtherPeek demo version. In the laboratory work, using a protocol analyzer demo version of EtherPeek NX, which has the following limitations:
Duration of the capture process is limited to 30 seconds.
No more than 5 windows capture (Capture) can be opened.
Only for the first 250 packages analyze and provide statistics.
Network statistics provided only during the first 5 minutes.
Printing and saving statistics are locked.
Ability to connect external additional modules disabled.
Figure 7.2.16 – Master of filter’s creation
Figure 7.2.17 – Filter for ARP-request capture from computer A
|
|
|
|
|
Дата добавления: 2014-12-27; Просмотров: 934; Нарушение авторских прав?; Мы поможем в написании вашей работы!