КАТЕГОРИИ:
Архитектура-(3434)Астрономия-(809)Биология-(7483)Биотехнологии-(1457)Военное дело-(14632)Высокие технологии-(1363)География-(913)Геология-(1438)Государство-(451)Демография-(1065)Дом-(47672)Журналистика и СМИ-(912)Изобретательство-(14524)Иностранные языки-(4268)Информатика-(17799)Искусство-(1338)История-(13644)Компьютеры-(11121)Косметика-(55)Кулинария-(373)Культура-(8427)Лингвистика-(374)Литература-(1642)Маркетинг-(23702)Математика-(16968)Машиностроение-(1700)Медицина-(12668)Менеджмент-(24684)Механика-(15423)Науковедение-(506)Образование-(11852)Охрана труда-(3308)Педагогика-(5571)Полиграфия-(1312)Политика-(7869)Право-(5454)Приборостроение-(1369)Программирование-(2801)Производство-(97182)Промышленность-(8706)Психология-(18388)Религия-(3217)Связь-(10668)Сельское хозяйство-(299)Социология-(6455)Спорт-(42831)Строительство-(4793)Торговля-(5050)Транспорт-(2929)Туризм-(1568)Физика-(3942)Философия-(17015)Финансы-(26596)Химия-(22929)Экология-(12095)Экономика-(9961)Электроника-(8441)Электротехника-(4623)Энергетика-(12629)Юриспруденция-(1492)Ядерная техника-(1748)
The use of areas
|
|
|
|
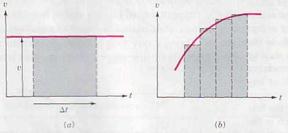
The previous sections have shown how to obtain the velocity from a position-time graph and the acceleration from a velocity-time graph. We now discuss the inverse problems of determining x from a graph of υ versus t and υ from a graph of a versus t. For motion at constant velocity, the υ versus t graph is a horizontal line, as shown in Fig. 3.13 a. Since υ = ∆ x /∆ t, the displacement ∆x in a time interval ∆t is given by ∆ x = υ ∆ t. This is just the area of the shaded rectangle of height υ and width ∆t. Notice that the unit of this area is (m/s)(s) = m.
|
| FIGURE 2.7 |
The area under any curve may be approximated by the sum of the areas of rectangles of appropriate heights, as in Fig. 2.7 b. The approximation improves as the number of rectangles is increased. In general, the displacement ∆ x in some time interval is given by the area under the υ versus t graph for that interval. Since a negative velocity leads to a negative displacement, areas below the time axis are negative.
|
| FIGURE 2.8 |
In an analogous way, the equation ∆ υ = a ∆ t leads to the following conclusion: For a given time interval, the area under the a versus t graph gives the change in velocity ∆ υ during that interval.
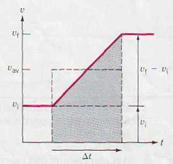
Consider now the case of a body whose velocity increases with constant acceleration, as shown in Fig. 2.8. The initial velocity is υi and the final velocity is υf after a time interval ∆t. The area of the shaded trapezoid is the sum of the area of the rectangle and a triangle: (υi∆ t)+1/2(υf − υi)∆ t =1/2(υi − υf)∆ t. This is the same as the area of a rectangle of height (υi + υf)/2 and width ∆ t. From Eq.2.3, the displacement is

| (2.8) |
Equation 2.8 shows that for the special case of constant acceleration, we may write υav = (υi + υf)/2.
|
|
|
|
|
Дата добавления: 2014-01-05; Просмотров: 326; Нарушение авторских прав?; Мы поможем в написании вашей работы!